This documentation is for the older UMH Classic version. If you are using the newer UMH Core, please visit
https://docs.umh.app
for the current documentation.
The United Manufacturing Hub is an Open-Source Helm Chart for Kubernetes, which combines state-of -the-art IT / OT tools & technologies and brings them into the hands of the engineer.
Bringing the worlds best IT and OT tools into the hands of the engineer
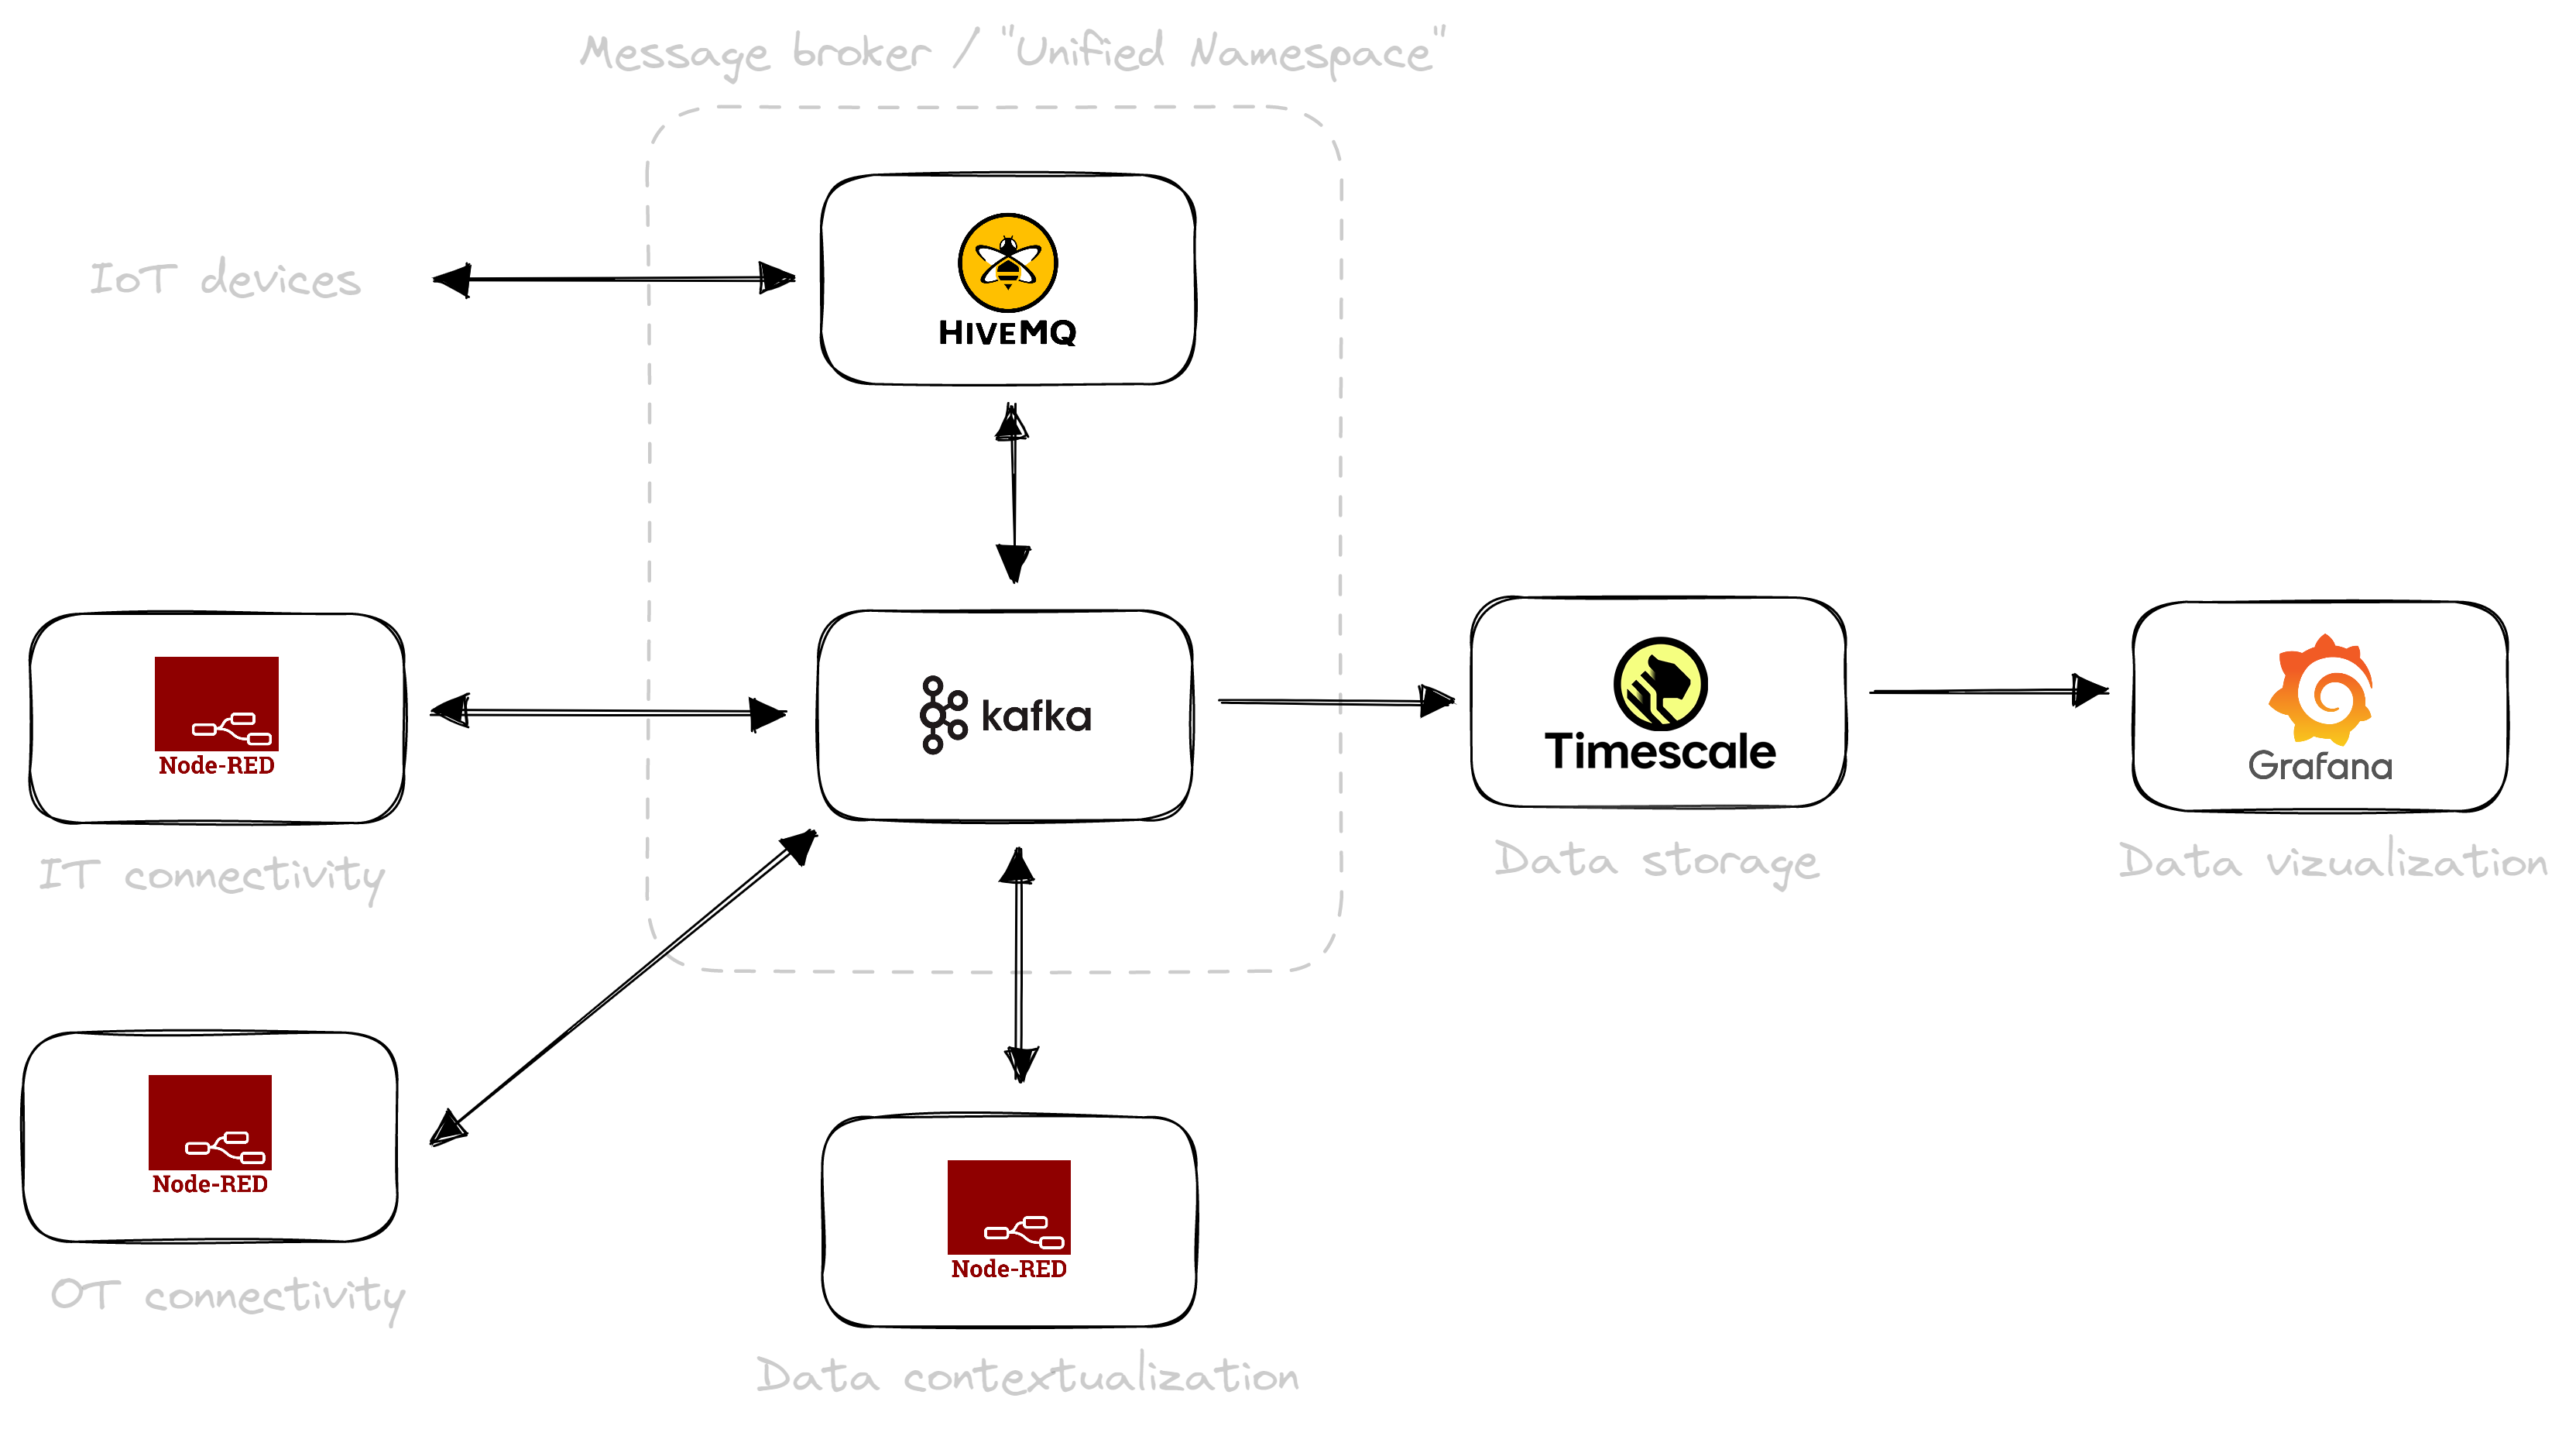
Why start from scratch when you can leverage a proven open-source blueprint? Kafka, MQTT, Node-RED, TimescaleDB and Grafana with the press of a button - tailored for manufacturing and ready-to-go
What can you do with it?
Everything That You Need To Do To Generate Value On The Shopfloor
Exchange and store data using HiveMQ for IoT devices, Apache Kafka as enterprise message broker, and TimescaleDB as a reliable relational and time-series storage solution
Visualize data using Grafana and factoryinsight to build powerful shopfloor dashboards
Prevent Vendor Lock-In and Customize to Your Needs
The only requirement is Kubernetes, which is available in various flavors, including k3s, bare-metal k8s, and Kubernetes-as-a-service offerings like AWS EKS or Azure AKS
Swap components with other options at any time. Not a fan of Node-RED? Replace it with Kepware. Prefer a different MQTT broker? Use it!
Leverage existing systems and add only what you need.
Get Started Immediately
Download & install now, so you can show results instead of drawing nice boxes in PowerPoint
Connect with Like-Minded People
Tap into our community of experts and ask anything. No need to depend on external consultants or system integrators.
Leverage community content, from tutorials and Node-RED flows to Grafana dashboards. Although not all content is enterprise-supported, starting with a working solution saves you time and resources.
Get honest answers in a world where many companies spend millions on advertising.
How does it work?
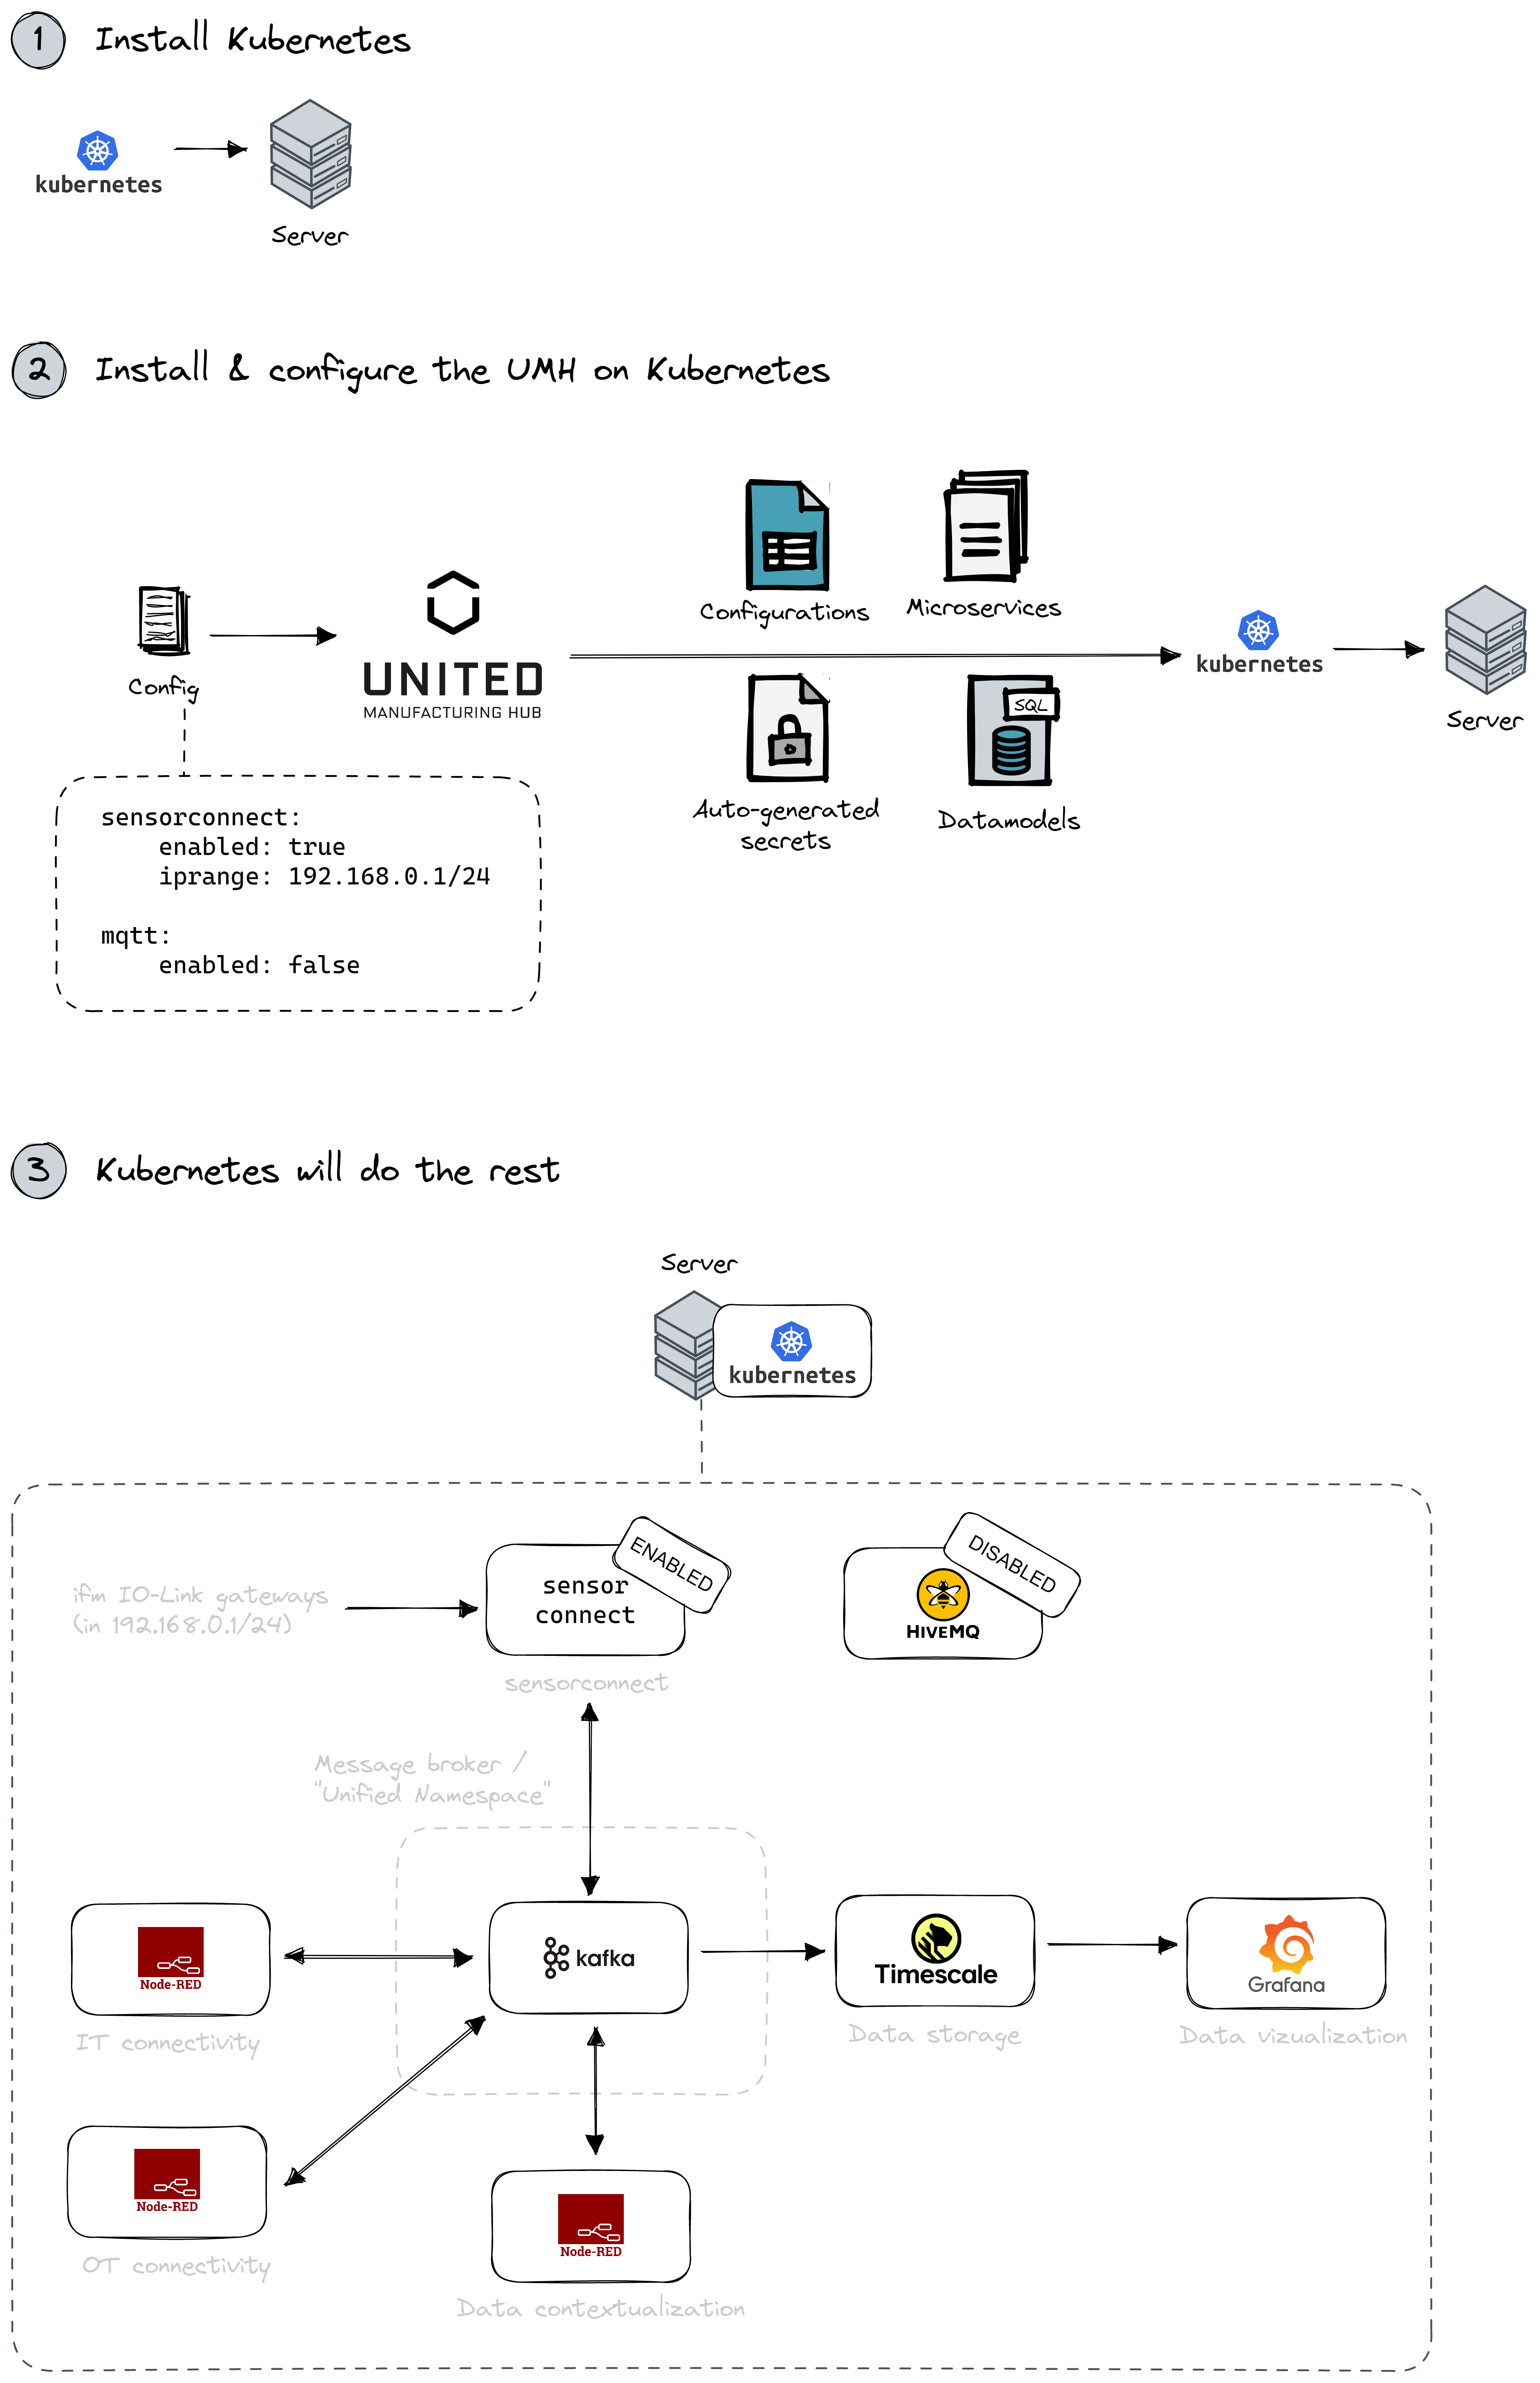
Only requirement: a Kubernetes cluster (and we'll even help you with that!). You only need to install the United Manufacturing Hub Helm Chart on that cluster and configure it.
The United Manufacturing Hub will then generate all the required files for Kubernetes, including auto-generated secrets, various microservices like bridges between MQTT / Kafka, datamodels and configurations. From there on, Kubernetes will take care of all the container management.
Yes - the United Manufacturing Hub is targeting specifically people and companies, who do not have the budget and/or knowledge to work on their own / develop everything from scratch.
With our extensive documentation, guides and knowledge sections you can learn everything that you need.
The United Manufacturing Hub abstracts these tools and technologies so that you can leverage all advantages, but still focus on what really matters: digitizing your production.
With our commercial Management Console you can manage your entire IT / OT infrastructure and work with Grafana / Node-RED without the need to ever touch or understand Kubernetes, Docker, Firewalls, Networking or similar.
Additionally, you can get support licenses providing unlimited support during development and maintenance of the system. Take a look at our website if you want to get more information on this.
Because very often these solutions do not target the actual pains of an engineer: implementation and maintenance. And then companies struggle in rolling out IIoT as the projects take much longer and cost way more than originally proposed.
In the United Manufacturing Hub, implementation and maintenance of the system are the first priority. We've had these pains too often ourselves and therefore incorporated and developed tools & technologies to avoid them.
For example, with sensorconnect we can retrofit production machines where it is impossible at the moment to extract data. Or, with our modular architecture we can fit the security needs of all IT departments -
from integration into a demilitarized zone to on-premise and private cloud. With Apache Kafka we solve the pain of corrupted or missing messages when scaling out the system
How to proceed?
1 - Get Started!
You want to get started right away? Go ahead and jump into the action!
Great to see you’re ready to start! This guide has 3 steps:
Installation, Data Acquisition and Manipulation, and Data Visualization.
Contact Us!
Do you still have questions on how to get started? Message us on our
Discord Server.
1.1 - 1. Installation
Install the United Manufacturing Hub together with all required tools on a Linux Operating System.
If you are new to the United Manufacturing Hub and need a place to start, this
is the place to be. You will be guided through setting up an account,
installing your first instance and connecting to an OPC UA simulator in no time.
Requirements
Device
You will need an edge device, bare metal server or virtual machine with
internet access. The device should meet the following
minimum requirements or the installation will fail:
ARM-based systems, such as a Raspberry Pi, are not currently supported.
An SSD is required, as the UMH’s data buffering process is I/O intensive, particularly with Kafka. For production environments, we recommend dedicating a separate SSD for the UMH rather than sharing it with other VMs, to ensure optimal read/write performance and avoid bottlenecks.
Ensure the root partition (/) has at least of free space.
For more detailed information on the installation (e.g., specific considerations for VM installations), please see here.
Operating System
We support the following operating systems:
You can find the image for Rocky in the Management Console when you are
setting up your first instance. A minimal installation (without GUI) is sufficient
and recommended for faster setup.
Newer or older versions of the operating system, or other operating systems
such as Ubuntu, may work, but please note that we do not support them
commercially.
Network
A personal computer with a recent browser to access the
Management Console.
Ensure that management.umh.app is allowlisted on TCP port 443 for HTTPS traffic.
Once logged in with your new account, click on
Add Your First Instance.
The Community Edition is limited to one user per organization. For multi-user support, please consider our Enterprise Edition.
Create your first Instance
First you have to set up your device and install the operating system.
We support , but we strongly recommend
using Rocky. You can find a list of the requirements and the image for
Rocky by clicking on the REQUIREMENTS button on the right hand side of the
Management Console.
Once you have successfully installed
your operating system, you can configure your instance in the Management
Console. For the first instance you should only change the Name and
Location of the instance. These will help you to identify an instance
if you have more than one.
Once the name and location are set,
continue by clicking on the Add Instance button. To install the UMH, copy
the command shown in the dialogue box, SSH into the new machine, paste the
command and follow the instructions. This command will run the installation
script for the UMH and connect it to your Management Console account.
If the UMH installation was
successful, you can click the Continue button. Your instance should appear in the Instances and Topology sections of the left-hand menu after a few minutes.
What’s next?
Once you installed UMH, you can continue with the
next page to learn how to
connect an OPC UA server to your instance.
1.2 - 2. Data Acquisition and Manipulation
Learn how to connect your UMH to an OPC UA server and format data into the UMH data model.
Once your UMH instance is up and running, you can follow this guide to learn
how to connect the instance to an OPC UA server. For this example we will use
the OPC UA simulator that is provided by your instance.
Connect to external devices
You can connect your UMH instances to external devices using a variety of
protocols. This is done in the Management Console and consists of two steps.
First you connect to the device and check that your instance can reach it. The
second step is to create a protocol converter for the connection, in which you
define the data you want to collect and how it should be structured in your
unified namespace.
To allow you to experience the UMH as quickly as possible, the
connection to the internal OPC UA simulator is already pre-configured.
Therefore, the Add a Connection section is included for reference
only. You can skip to Add a Protocol Converter below.
Add a Connection
To create a new connection, navigate to the Connections section in the
left hand menu and click on the + Add Connection button in the top right
hand corner.
If you want to configure the connection to the OPC UA simulator by yourself,
delete the preconfigured connection named
default-opcua-simulator-connection.
Having two connections to the same device can cause errors when deploying
the Protocol Converter!
Under General Settings select your instance and give the connection a
name. Enter the address and port of the device you want to connect to. To
connect to the OPC UA Simulator, use
You can also set additional location fields to help you keep track of your
of your connections. The fields already set by the selected instance are
inherited and cannot be changed.
Once everything is set up, you can click Save & Deploy. The instance
will now attempt to connect to the device on the specified IP and port. If
there is no error, it will be listed in the Connections section.
Click on the connection to view its details, to edit click on the
Configuration button in the side panel.
Add a Protocol Converter
To access the data from the OPC UA Simulator you need to add a
Protocol Converter to the connection.
Click on the connection to the OPC UA Simulator in the Connections table.
If you are using the preconfigured one, it is called default-opcua-simulator-connection.
Click on the + Add Protocol Converter button in the opening menu.
First you need to select the protocol used to communicate with the device,
in this case OPC UA. This can be found under General.
Input: Many of the required details are already set based on the
connection details. For this tutorial, we will subscribe to a tag and a folder
on the OPC UA server. Tags and folders can be selected manually using
the NodeID or by using the OPC UA Browser.
If you want to select the nodes via the OPC UA Browser, uncheck the Root
box, navigate to Root/Objects/Boilers/Boiler #2 and select the
ParameterSet folder. Next navigate to
Root/Objects/OpcPlc/Telemetry/Fast and select the FastUInt1 tag, then
click Apply at the bottom.
To add the nodes manually, close the OPC UA Browser by clicking on the
OPC UA BROWSER button at the right edge of the window.
The nodes must be added as Namespaced String NodeIDs.
Now copy the code below and replace the current nodeIDs: with it.
nodeIDs:- ns=4;i=5020- ns=3;s=FastUInt1
In the input section, you must also specify the OPC UA server username and
password, if it uses one.
The Input should now look like this.
Note that the indentation is important.
Processing: In this section you can manipulate the incoming data and
sort it into the desired asset. The auto-generated configuration will sort
each tag into the same asset based on the location used for the instance and
connection, while the tag name will be based on the name of the tag on the OPC
UA server.
Further information can be found in the OPC UA Processor section next to
the Processing field, for example how to create individual assets for
each tag.
Output: The output section is generated entirely automatically by the
Management Console.
Now click on Save & Deploy. Your Protocol Converter will be added.
To view the data, navigate to the Tag Browser on the left. Here, you can
see all your tags. The tree on the left is build from the asset of each tag,
you can navigate it by clicking on the asset parts.
Next, we’ll dive into Data Visualisation,
where you’ll learn how to create Grafana dashboards with your newly collected
data.
1.3 - 3. Data Visualization
Build a simple Grafana dashboard with the gathered data.
After bringing the data from the OPC UA simulator into your Unified Namespace,
you can use Grafana to create dashboards to display it. If you haven’t
already connected the OPC UA simulator to your instance, you can follow the
previous guide.
Accessing Grafana
Make sure you are on the same network as your instance to access Grafana.
In the Management Console, select Applications from the left hand
menu. Click on Historian (Grafana) for the instance to which you have
connected the OPC UA simulator. You can search for your instance’s applications
by entering its name in the Filter by name or instance field at the top of
the page.
Click on the URL displayed in the side panel that opens. This will only work
if you have set the correct IP address for your instance during the
installation script. If you can’t connect to Grafana, find out the IP address
of your instance and enter the following URL in your browser
http://<IP-address-of-your-instance>:8080
Copy the Grafana password by clicking on it in the side panel of the
application. The user name is admin.
To add a dashboard, click on Dashboards in the left menu and then on the
blue + Create Dashboard button in the middle of the page. On the next page
click + Add visualisation.
Select the UMH TimescaleDB data source in the Select data source
dialogue box.
To access data from your Unified Namespace in Grafana, you can use SQL
queries generated by the Management Console for each tag. Open the
Tag Browser and navigate to the desired tag, e.g. CurrentTemperature
from the ParameterSet folder of the OPC UA Simulator. The query is located
at the bottom of the page under SQL Query. Make sure it is set to
Grafana and then copy it.
In Grafana, change the query mode to Code by toggling the
Builder/Code switch located on the right hand side of the page next to the
blue Run query button. Paste the query you copied from the Management
Console into the text box.
Click the blue Run query button. If everything is set up correctly you
should see the data displayed in a graph.
There are many ways to customise the graph on the right hand side of the
page. For example, you can use different colours or chart styles. You can also
add more queries at the bottom of the page.
When you are happy, click the blue Apply button in the top right
corner. You will now see the dashboard. You can adjust the size and position
of the graph or access other options by clicking on the three dots in the top
right hand corner of the graph. To add another graph, click Add and then
Visualisation from the menu bar at the top of the page.
To save your dashboard, press Ctrl + S.
Further Reading
If you would like to find out more about the United Manufacturing Hub, here
are some links to get you links to get you started.
General knowledge, updates and guidance? Check out our Learn page:
Learn how to manage your UMH instance and resolve common issues.
This chapter covers the management and troubleshooting of your United Manufacturing Hub (UMH) instance.
The usual way to interact with your UMH instance is through the Management Console.
However, for heavy troubleshooting or automations, you might want to interact with your instance through the command line.
This chapter will guide you through the process of accessing your instance, as well as provide you with some common commands and how to resolve issues.
Manage the Instance
Before you begin, ensure that you are connected to the same network as the
instance for accessing the various services and features discussed below.
Access the Command Line
Access your device’s shell either directly or via SSH. Note: Root user access is required for the following commands.
Interact with the Instance
First, set this environment variable:
exportKUBECONFIG=/etc/rancher/k3s/k3s.yaml
You can bypass this by adding the flag --kubeconfig /etc/rancher/k3s/k3s.yaml to all your kubectl commands. Root privileges are needed to access it.
The installation path of kubectl might vary (e.g., /usr/local/bin/kubectl on RHEL/Linux,
/opt/bin/kubectl on flatcar).
Then, to get a list of pods, run:
sudo $(which kubectl) get pods -n united-manufacturing-hub --kubeconfig /etc/rancher/k3s/k3s.yaml
Always specify the namespace when running a command by adding -n united-manufacturing-hub or set the default namespace with kubectl config set-context --current --namespace=united-manufacturing-hub.
Access Node-RED
Node-RED is used in UMH for creating data flows. Access it via:
http://<instance-ip-address>:1880/nodered
Access Grafana
UMH uses Grafana for dashboard displays. Get your credentials:
This command will open a psql shell connected to the default postgres database.
Run SQL queries as needed. For an overview of the database schema, refer to the
Data Model documentation.
Connect MQTT to MQTT Explorer
Use MQTT Explorer for a structured overview of MQTT topics. Connect using the instance’s IP and port 1883.
Troubleshooting
Error: You must be logged in to the server while using the 'kubectl' Command
If you encounter the error below while using the kubectl command:
E1121 13:05:52.772843  218533 memcache.go:265] couldn't get current server API group list: the server has asked for the client to provide credentials
error: You must be logged in to the server (the server has asked for the client to provide credentials)
This issue can be resolved by setting the KUBECONFIG environment variable. Run
the following command:
exportKUBECONFIG=/etc/rancher/k3s/k3s.yaml
Alternatively, use the --kubeconfig flag to specify the configuration file path:
sudo $(which kubectl) --kubeconfig /etc/rancher/k3s/k3s.yaml get pods -n united-manufacturing-hub
“Permission Denied” Error with ‘kubectl’ Command
Encountering the error below while using the kubectl command:
error: error loading config file "/etc/rancher/k3s/k3s.yaml": open /etc/rancher/k3s/k3s.yaml: permission denied
Indicates the need for root access. Run the command with sudo, or log in as
the root user.
kubectl: command not found
If you encounter the error below while using the kubectl command:
kubectl: command not found
The solution is to use the full path to the kubectl binary. You can do this by
prefixing the command with /usr/local/bin/ (for RHEL and other Linux systems), or /opt/bin/ (for flatcar) or by adding it to your PATH
environment variable:
/usr/local/bin/kubectl get pods -n united-manufacturing-hub
# orexportPATH=$PATH:/usr/local/bin
Viewing Pod Logs for Troubleshooting
Logs are essential for diagnosing and understanding the behavior of your applications and infrastructure. Here’s how to view logs for key components:
Management Companion Logs: To view the real-time logs of the Management Companion, use the following command. This can be helpful for monitoring the Companion’s activities or troubleshooting issues.
TimescaleDB Logs: For real-time logging of the TimescaleDB, execute this command. It’s useful for tracking database operations and identifying potential issues.
Consume Messages from a Topic: To view messages from a topic like umh.v1.e2e-enterprise.aachen.packaging, this command is useful for real-time data observation:
Access key services like Node-RED, Grafana, and RedPanda
Now that you have these essential management skills, you can proceed to Data Acquisition and Manipulation to start creating your first data flow.
2 - Features
Do you want to understand the capabilities of the United Manufacturing Hub, but do not want to get lost in technical architecture diagrams? Here you can find all the features explained on few pages.
2.1 - Connectivity
Introduction to IIoT Connections and Data Sources Management in the
United Manufacturing Hub.
In IIoT infrastructures, sometimes can be challenging to extract and contextualize
data from from various systems into the Unified Namespace, because there is no
universal solution. It usually requires lots of different tools, each one
tailored to the specific infrastructure, making it hard to manage and maintain.
With the United Manufacturing Hub and the Management Console, we aim to solve
this problem by providing a simple and easy to use tool to manage all the assets
in your factory.
For lack of a better term, when talking about a system that can be connected to
and that provides data, we will use the term asset.
When should I use it?
Contextualizing data can present a variety of challenges, both technical and
at the organization level. The Connection Management functionality aims to reduce
the complexity that comes with these challenges.
Here are some common issues that can be solved with the Connection Management:
It is hard to get an overview of all the data sources and their connections'
status, as the concepts of “connection” and “data source” are often decoupled.
This leads to list the connections’ information into long spreadsheets, which
are hard to maintain and troubleshoot.
Handling uncommon communication protocols.
Dealing with non-standard connections, like a 4-20 mA sensor or a USB-connected
barcode reader.
Advanced IT tools like Apache Spark or
Apache Flink may be challenging for OT personnel
who have crucial domain knowledge.
Traditional OT tools often struggle in modern IT environments, lacking features
like Docker compatibility, monitoring, automated backups, or high availability.
What can I do with it?
The Connection Management functionality in the Management Console aims to
address those challenges by providing a simple and easy to use tool to manage
all the assets in your factory.
You can add, delete, and most importantly, visualize the status of all your
connections in a single place. For example, a periodic check is performed to
measure the latency of each connection, and the status of the connection is
displayed in the Management Console.
You can also add notes to each connection, so that you can keep all the documentation
in a single place.
You can then configure a data source for each connection, to start extracting
data from your assets. Once the data source is configured, specific information
about its status is displayed, prompting you in case of misconfigurations, data
not being received, or other any error that may occur.
How can I use it?
Add new connections from the Connection Management page of the Management Console.
Then, configure a data source for each of them by choosing one of the available
tools, depending on the type of connection.
The following tools come with the United Manufacturing Hub and are recommended
for extracting data from your assets:
Node-RED
Node-RED is a leading open-source tool for IIoT
connectivity. We recommend this tool for prototyping and integrating parts of the
shop floor that demand high levels of customization and domain knowledge.
Even though it may be unreliable in high-throughput scenarios, it has a vast
global community that provides a wide range of connectors for different protocols
and data sources, while remaining very user-friendly with its visual programming
approach.
Benthos UMH
Benthos UMH is a custom extension of the Benthos
project. It allows you to connect assets that communicate via the OPC UA protocol,
and it is recommended for scenarios involving the extraction of large data volumes
in a standardized format.
It is a lightweight, open-source tool that is easy to deploy and manage. It is
ideal for moving medium-sized data volumes more reliably then Node-RED, but it
requires some technical knowledge.
Other Tools
The United Manufacturing Hub also provides tools for connecting data sources
that uses other types of connections. For example, you can easily connect
ifm IO-Link
sensors or USB barcode readers.
Third-Party Tools
Any existing connectivity solution can be integrated with the United
Manufacturing Hub, assuming it can send data to either MQTT or Kafka.
Additionally, if you want to deploy those tools on the Device & Container
Infrastructure, they must be available as a Docker container (developed with best-practices).
Therefore, we recommend using the tools mentioned above, as they are the most
tested and reliable.
What are the limitations?
Some of the tools still require some technical knowledge to be used. We are
working on improving the user experience and documentation to make them more
accessible.
Where to get more information?
Follow the Get started guide to learn how to connect
your assets to the United Manufacturing Hub.
Connect devices on the shop floor using Node-RED with United Manufacturing Hub’s Unified Namespace. Simplify data integration across PLCs, Quality Stations, and MES/ERP systems with a user-friendly UI.
One feature of the United Manufacturing Hub is to connect devices on the shopfloor such as PLCs, Quality Stations or
MES / ERP systems with the Unified Namespace using Node-RED.
Node-RED has a large library of nodes, which lets you connect various protocols. It also has a user-friendly UI
with little code, making it easy to configure the desired nodes.
When should I use it?
Sometimes it is necessary to connect a lot of different protocols (e.g Siemens-S7, OPC-UA, Serial, …) and node-RED can be a maintainable
solution to connect all these protocols without the need for other data connectivity tools. Node-RED is largely known in
the IT/OT-Community making it a familiar tool for a lot of users.
What can I do with it?
By default, there are connector nodes for common protocols:
connect to MQTT using the MQTT node
connect to HTTP using the HTTP node
connect to TCP using the TCP node
connect to IP using the UDP node
Furthermore, you can install packages to support more connection protocols. For example:
You can additionally contextualize the data, using function or other different nodes do manipulate the
received data.
How can I use it?
Node-RED comes preinstalled as a microservice with the United Manufacturing Hub.
To access Node-RED, simply open the following URL in your browser:
http://<instance-ip-address>:1880/nodered
Begin exploring right away! If you require inspiration on where to start, we provide a variety of guides to help you
become familiar with various node-red workflows, including how to process data and align it with the UMH datamodel:
Alternatively, visit learning page where you can find multiple best practices for using Node-RED
What are the limitations?
Most packages have no enterprise support. If you encounter any errors, you need to ask the community.
However, we found that these packages are often more stable than the commercial ones out there,
as they have been battle tested by way more users than commercial software.
Having many flows without following a strict structure, leads in general to confusion.
One additional limitation is “the speed of development of Node-RED”. After a big Node-RED and JavaScript update
dependencies most likely break, and those single community maintained nodes need to be updated.
Where to get more information?
Learn more about Node-RED and the United Manufacturing Hub by following our Get started guide .
Configure protocol converters to stream data to the Unified Namespace directly in the Management Console.
Benthos is a stream processing tool that
is designed to make common data engineering tasks such as transformations,
integrations, and multiplexing easy to perform and manage. It uses declarative,
unit-testable configuration, allowing users to easily adapt their data
pipelines as requirements change. Benthos is able to connect to a wide range of
sources and sinks, and can use different languages for processing and mapping
data.
Benthos UMH is a custom extension of
Benthos that is designed to connect to OPC-UA servers and stream data into the
Unified Namespace.
When should I use it?
Benthos UMH is valuable for integrating different protocols with the Unified Namespace.
With it, you can configure various protocol converters, define the data you want to
stream, and send it to the Unified Namespace.
Furthermore, in our tests,
Benthos has proven more reliable than tools like Node-RED, when it comes to
handling large amounts of data.
What can I do with it?
Benthos UMH offers some benefits, including:
Management Console integration: Configure and deploy any number of protocol converters via
Benthos UMH directly from the Management Console.
OPC-UA support: Connect to any OPC-UA server and stream data into the
Unified Namespace.
Report by exception: By configuring the OPC-UA nodes in subscribe mode,
you can only stream data when the value of the node changes.
Per-node configuration: Define the nodes you want to stream and configure
them individually.
Broad customization: Use Benthos’ extensive configuration options to
customize your data pipeline.
Easy deployment: Deploy Benthos UMH as a standalone Docker container or
directly from the Management Console.
Fully open source: Benthos UMH is fully open source and available on
Github.
How can I use it?
With the Management Console
The easiest way to use Benthos UMH is to deploy it directly from the Management
Console.
After adding your network device or service, you can initialize the protocol
converter. Simply click on the Play button next to the network device/service
at the Protocol Converters tab.
From there, you’ll have two options to choose from when configuring the
protocol converter:
OPC-UA: Select this option if you specifically need to configure
OPC-UA protocol converters. It offers direct integration with OPC-UA servers
and improved data contextualization. This is particularly useful when you need
to assign tags to specific data points within the Unified Namespace. You’ll be
asked to define OPC-UA nodes in YAML format, detailing the nodes you want to stream
from the OPC-UA server.
Universal Protocol Converter: Opt for this choice if you need to configure
protocol converters for various supported protocols other than OPC-UA. This option
will prompt you to define the Benthos input and processor configuration in YAML format.
For OPC-UA, ensure your YAML configuration follows the format below:
Required fields are opcuaID, enterprise, tagName and schema. opcuaID
is the NodeID in OPC-UA and can also be a folder (see README
for more information). The remaining components are components of the resulting
topic / ISA-95 structure (see also our datamodel). By default,
the schema will always be in _historian, and tagName is the keyname.
Standalone
Benthos UMH can be manually deployed as part of the UMH stack using the provided Docker
image and following the instructions outlined in the README.
For more specialized use cases requiring precise configuration, standalone deployment
offers full control over the setup. However, this manual approach is more complex
compared to using the Universal Protocol Converter feature directly from the
Management Console.
Read the official Benthos documentation
for more information on how to use different components.
What are the limitations?
Benthos UMH excels in scalability, making it a robust choice for complex setups
managing large amounts of data. However, its initial learning curve may be steeper
due to its scripting language and a more hands-on approach to configuration.
As an alternative, Node-RED offers ease of use with its low-code approach and the
popularity of JavaScript. It’s particularly easy to start with, but as your setup grows,
it becomes harder to manage, leading to confusion and loss of oversight.
2.1.3.1 - Retrofitting with ifm IO-link master and sensorconnect
Upgrade older machines with ifm IO-Link master and Sensorconnect for seamless data collection and integration. Retrofit your shop floor with plug-and-play sensors for valuable insights and improved efficiency.
Retrofitting older machines with sensors is sometimes the only-way to capture process-relevant information.
In this article, we will focus on retrofitting with ifm IO-Link master and
Sensorconnect, a microservice of the United Manufacturing Hub, that finds and reads out ifm IO-Link masters in the
network and pushes sensor data to MQTT/Kafka for further processing.
When should I use it?
Retrofitting with ifm IO-Link master such as the AL1350 and using Sensorconnect is ideal when dealing with older machines that are not
equipped with any connectable hardware to read relevant information out of the machine itself. By placing sensors on
the machine and connecting them with IO-Link master, required information can be gathered for valuable
insights. Sensorconnect helps to easily connect to all sensors correctly and properly capture the large
amount of sensor data provided.
What can I do with it?
With ifm IO-Link master and Sensorconnect, you can collect data from sensors and make it accessible for further use.
Sensorconnect offers:
Automatic detection of ifm IO-Link masters in the network.
Identification of IO-Link and alternative digital or analog sensors connected to the master using converter such as the DP2200.
Digital Sensors employ a voltage range from 10 to 30V DC, producing binary outputs of true or false. In contrast, analog sensors operate at 24V DC, with a current range spanning from 4 to 20 mA. Utilizing the appropriate converter, analog outputs can be effectively transformed into digital signals.
Constant polling of data from the detected sensors.
Interpreting the received data based on a sensor database containing thousands of entries.
Sending data in JSON format to MQTT and Kafka for further data processing.
How can I use it?
To use ifm IO-link gateways and Sensorconnect please follow these instructions:
Ensure all IO-Link gateways are in the same network or accessible from your instance of the United Manufacturing Hub.
Retrofit the machines by connecting the desired sensors and establish a connection with ifm IO-Link gateways.
Deploy the sensorconnect feature and configure the Sensorconnect IP-range to either match the IP address using subnet notation /32, or, in cases involving multiple masters, configure it to scan an entire range, for example /24. To deploy the feature and change the value, execute the following command with your IP range:
Once completed, the data should be available in your Unified Namespace.
What are the limitations?
The current ifm firmware has a software bug, that will cause the IO-Link master to crash if it receives to many requests.
To resolve this issue, you can either request an experimental firmware, which is available exclusively from ifm, or re-connect the power to the IO-Link gateway.
Integrate USB barcode scanners with United Manufacturing Hub’s barcodereader microservice for seamless data publishing to Unified Namespace. Ideal for inventory, order processing, and quality testing stations.
The barcodereader microservice enables the processing of barcodes from USB-linked scanner devices, subsequently publishing the acquired
data to the Unified Namespace.
When should I use it?
When you need to connect a barcode reader or any other USB devices acting as a keyboard (HID). These cases could be to scan an order
at the production machine from the accompanying order sheet. Or To scan material for inventory and track and trace.
What can I do with it?
You can connect USB devices acting as a keyboard to the Unified Namespace. It will record all inputs and send it out once
a return / enter character has been detected. A lof of barcode scanners work that way. Additionally, you can also connect
something like a quality testing station (we once connected a Mitutoyo quality testing station).
How can I use it?
To use the microservice barcode reader, you will need configure the helm-chart and enable it.
Enable the barcodereader feature by executing the following command:
During startup, it will show all connected USB devices. Remember yours and then change the INPUT_DEVICE_NAME and INPUT_DEVICE_PATH. Also set ASSET_ID, CUSTOMER_ID, etc. as this will then send it into the topic ia/ASSET_ID/.../barcode. You can change these values of the helm chart using helm upgrade. You find the list of parameters here. The following command should be executed, for example:
Scan a device, and it will be written into the topic ia/ASSET_ID/.../barcode.
Once installed, you can configure the microservice by
setting the needed environment variables. The program will continuously scan for barcodes using the device and publish
the data to the Kafka topic.
What are the limitations?
Sometimes special characters are not parsed correctly. They need to be adjusted afterward in the Unified Namespace.
This page describes the data infrastructure of the United Manufacturing Hub.
2.2.1 - Unified Namespace
Seamlessly connect and communicate across shopfloor equipment, IT/OT systems,
and microservices.
The Unified Namespace is a centralized, standardized, event-driven data
architecture that enables for seamless integration and communication across
various devices and systems in an industrial environment. It operates on the
principle that all data, regardless of whether there is an immediate consumer,
should be published and made available for consumption. This means that any
node in the network can work as either a producer or a consumer, depending on
the needs of the system at any given time.
This architecture is the foundation of the United Manufacturing Hub, and you
can read more about it in the Learning Hub article.
When should I use it?
In our opinion, the Unified Namespace provides the best tradeoff for connecting
systems in manufacturing / shopfloor scenarios. It effectively eliminates the
complexity of spaghetti diagrams and enables real-time data processing.
While data can be shared through databases,
REST APIs,
or message brokers, we believe that a message broker approach is most suitable
for most manufacturing applications. Consequently, every piece of information
within the United Manufacturing Hub is transmitted via a message broker.
Both MQTT and Kafka are used in the United Manufacturing Hub. MQTT is designed
for the safe message delivery between devices and simplifies gathering data on
the shopfloor. However, it is not designed for reliable stream processing.
Although Kafka does not provide a simple way to collect data, it is suitable
for contextualizing and processing data. Therefore, we are combining both the
strengths of MQTT and Kafka. You can get more information from this article.
What can I do with it?
The Unified Namespace in the United Manufacturing Hub provides you the following
functionalities and applications:
Seamless Integration with MQTT: Facilitates straightforward connection
with modern industrial equipment using the MQTT protocol.
Legacy Equipment Compatibility: Provides easy integration with older
systems using tools like Node-RED
or Benthos UMH,
supporting various protocols like Siemens S7, OPC-UA, and Modbus.
Real-time Notifications: Enables instant alerting and data transmission
through MQTT, crucial for time-sensitive operations.
Historical Data Access: Offers the ability to view and analyze past
messages stored in Kafka logs, which is essential for troubleshooting and
understanding historical trends.
Scalable Message Processing: Designed to handle a large amount of data
from a lot of devices efficiently, ensuring reliable message delivery even
over unstable network connections. By using IT standard tools, we can
theoretically process data in the measure of GB/second instead of
messages/second.
Data Transformation and Transfer: Utilizes the
Data Bridge
to adapt and transmit data between different formats and systems, maintaining
data consistency and reliability.
Each feature opens up possibilities for enhanced data management, real-time
monitoring, and system optimization in industrial settings.
You can view the Unified Namespace by using the Management Console like in the picture
below. The picture shows data under the topic
umh/v1/demo-pharma-enterprise/Cologne/_historian/rainfall/isRaining, where
umh/v1 is a versioning prefix.
demo-pharma-enterprise is a sample enterprise tag.
Cologne is a sample site tag.
_historian is a schema tag. Data with this tag will be stored in the UMH’s database.
rainfall/isRaining is a sample schema dependent context, where rainfall is a tag group and
isRaining is a tag belonging to it.
The full tag name uniquely identifies a single tag, it can be found in the Publisher & Subscriber Info table.
The above image showcases the Tag Browser, our main tool for navigating the Unified Namespace. It includes the
following features:
Data Aggregation: Automatically consolidates data from all connected instances / brokers.
Topic Structure: Displays the hierarchical structure of topics and which data belongs to which namespace.
Tag Folder Structure: Facilitates browsing through tag folders or groups within a single asset.
Schema validation: Introduces validation for known schemas such as _historian. In case of validation
failure, the corresponding errors are displayed.
Tag Error Tracing: Enables error tracing within the Unified Namespace tree. When errors are detected in tags
or schemas, all affected nodes are highlighted with warnings, making it easier to track down the troubled
source tags or schemas.
Publisher & Subscriber Info: Provides various details, such as the origins and destinations of the data,
the instance it was published from, the messages per minute to get an overview on how much data is flowing,
and the full tag name to uniquely identify the selected tag.
Payload Visualization: Displays payloads under validated schemas in a formatted/structured manner, enhancing
readability. For unknown schemas without strict validation, the raw payload is displayed instead.
Tag Value History: Shows the last 100 received values for the selected tag, allowing you to track the
changes in the data over time. Keep in mind that this feature is only available for tags that are part of the
_historian schema.
Example SQL Query: Generates example SQL queries based on the selected tag, which can be used to query the
data in the UMH’s database or in Grafana for visualization purposes.
Kafka Origin: Provides information about the Kafka key, topic and the actual payload that was sent via Kafka.
It’s important to note that data displayed in the Tag Browser represent snapshots; hence, data sent at
intervals shorter than 10 seconds may not be accurately reflected.
You can find more detailed information about the topic structure here.
You can also use tools like MQTT Explorer
(not included in the UMH) or Redpanda Console (enabled by defualt, accessible
via port 8090) to view data from a single instance (but single instance only).
How can I use it?
To effectively use the Unified Namespace in the United Manufacturing Hub, start
by configuring your IoT devices to communicate with the UMH’s MQTT broker,
considering the necessary security protocols. While MQTT is recommended for
gathering data on the shopfloor, you can send messages to Kafka as well.
Once the devices are set up, handle the incoming data messages using tools like
Node-RED
or Benthos UMH. This step involves
adjusting payloads and topics as needed. It’s also important to understand and
follow the ISA95 standard model for data organization, using JSON as the
primary format.
Additionally, the Data Bridge
microservice plays a crucial role in transferring and transforming data between
MQTT and Kafka, ensuring that it adheres to the UMH data model. You can
configure a merge point to consolidate messages from multiple MQTT topics into
a single Kafka topic. For instance, if you set a merge point of 3, the Data
Bridge will consolidate messages from more detailed topics like
umh/v1/plant1/machineA/temperature into a broader topic like umh/v1/plant1.
This process helps in organizing and managing data efficiently, ensuring that
messages are grouped logically while retaining key information for each topic
in the Kafka message key.
Recommendation: Send messages from IoT devices via MQTT and then work in
Kafka only.
What are the limitations?
While JSON is the only supported payload format due to its accessibility, it’s
important to note that it can be more resource-intensive compared to formats
like Protobuf or Avro.
Learn how the United Manufacturing Hub’s Historian feature provides reliable data storage and analysis for your manufacturing data.
The Historian / Data Storage feature in the United Manufacturing Hub provides
reliable data storage and analysis for your manufacturing data. Essentially, a
Historian is just another term for a data storage system, designed specifically
for time-series data in manufacturing.
When should I use it?
If you want to reliably store data from your shop floor that is not designed to
fulfill any legal purposes, such as GxP, we recommend you to use the United Manufacturing Hub’s
Historian feature. In our opinion, open-source databases such as TimescaleDB are
superior to traditional historians
in terms of reliability, scalability and maintainability,
but can be challenging to use for the OT engineer. The United Manufacturing Hub
fills this usability gap, allowing OT engineers to easily ingest, process, and
store data permanently in an open-source database.
What can I do with it?
The Historian / Data Storage feature of the United Manufacturing Hub allows you
to:
Store and analyze data
Store data in TimescaleDB by using either the
_historian
or _analytics_schemas
in the topics within the Unified Namespace.
Data can be sent to the Unified Namespace
from various sources,
allowing you to store tags from your PLC and production lines reliably.
Optionally, you can use tag groups to manage a large number of
tags and reduce the system load.
Our Data Model page
assists you in learning data modeling in the Unified Namespace.
Conduct basic data analysis, including automatic downsampling, gap filling,
and statistical functions such as Min, Max, and Avg.
Query and visualize data
Query data in an ISA95 compliant model,
from enterprise to site, area, production line, and work cell.
Visualize your data in Grafana to easily monitor and troubleshoot your
production processes.
Compress and retain data to reduce database size using various techniques.
How can I use it?
To store your data in TimescaleDB, simply use the _historian or _analytics_schemas in your Data Model v1
compliant topic. This can be directly done in the OPC UA data source
when the data is first inserted into the stack. Alternatively, it can be handled
in Node-RED, which is useful if you’re still utilizing the old data model,
or if you’re gathering data from non-OPC UA sources via Node-RED or
sensorconnect.
Data sent with a different _schema will not be stored in
TimescaleDB.
Data stored in TimescaleDB can be viewed in Grafana. An example can be found in
the Get Started guide.
In Grafana you can select tags by using SQL queries. Here, you see an example:
get_asset_id_immutable is a custom plpgsql function that we provide to simplify the
process of querying tag data from a specific asset. To learn more about our
database, visit this page.
Also, you have the option to query data in your custom code by utilizing the
API in factoryinsight or
processing the data in the
Unified Namespace.
For more information about what exactly is behind the Historian feature, check
out our our architecture page.
What are the limitations?
In order to store messages, you should transform data and use our topic
structure. The payload must be in JSON using
a specific format,
and the message must be tagged with _historian.
Learn more about the United Manufacturing Hub’s architecture by visiting
our architecture page.
Learn more about our Data Model by visiting this page.
Learn more about our database for _historian schema by visiting
our documentation.
2.2.3 - Shopfloor KPIs / Analytics (v1)
The Shopfloor KPI/Analytics feature of the United Manufacturing Hub provides equipment-based KPIs, configurable dashboards, and detailed analytics for production transparency. Configure OEE calculation and track root causes of low OEE using drill-downs. Easily ingest, process, and analyze data in Grafana.
The Shopfloor KPI / Analytics feature of the United Manufacturing Hub provides a configurable and plug-and-play approach to create “Shopfloor Dashboards” for production transparency consisting of various KPIs and drill-downs.
If you want to create production dashboards that are highly configurable and can drill down into specific KPIs, the Shopfloor KPI / Analytics feature of the United Manufacturing Hub is an ideal choice. This feature is designed to help you quickly and easily create dashboards that provide a clear view of your shop floor performance.
What can I do with it?
The Shopfloor KPI / Analytics feature of the United Manufacturing Hub allows you to:
Query and visualize
In Grafana, you can:
Calculate the OEE (Overall Equipment Effectiveness) and view trends over time
Availability is calculated using the formula (plannedTime - stopTime) / plannedTime, where plannedTime is the duration of time for all machines states that do not belong in the Availability or Performance category, and stopTime is the duration of all machine states configured to be an availability stop.
Performance is calculated using the formula runningTime / (runningTime + stopTime), where runningTime is the duration of all machine states that consider the machine to be running, and stopTime is the duration of all machine states that are considered a performance loss. Note that this formula does not take into account losses caused by letting the machine run at a lower speed than possible. To approximate this, you can use the LowSpeedThresholdInPcsPerHour configuration option (see further below).
Quality is calculated using the formula good pieces / total pieces
Drill down into stop reasons (including histograms) to identify the root-causes for a potentially low OEE.
List all produced and planned orders including target vs actual produced pieces, total production time, stop reasons per order, and more using job and product tables.
See machine states, shifts, and orders on timelines to get a clear view of what happened during a specific time range.
View production speed and produced pieces over time.
Configure
In the database, you can configure:
Stop Reasons Configuration: Configure which stop reasons belong into which category for the OEE calculation and whether they should be included in the OEE calculation at all. For instance, some companies define changeovers as availability losses, some as performance losses. You can easily move them into the correct category.
Automatic Detection and Classification: Configure whether to automatically detect/classify certain types of machine states and stops:
AutomaticallyIdentifyChangeovers: If the machine state was an unspecified machine stop (UnknownStop), but an order was recently started, the time between the start of the order until the machine state turns to running, will be considered a Changeover Preparation State (10010). If this happens at the end of the order, it will be a Changeover Post-processing State (10020).
MicrostopDurationInSeconds: If an unspecified stop (UnknownStop) has a duration smaller than a configurable threshold (e.g., 120 seconds), it will be considered a Microstop State (50000) instead. Some companies put small unknown stops into a different category (performance) than larger unknown stops, which usually land up in the availability loss bucket.
IgnoreMicrostopUnderThisDurationInSeconds: In some cases, the machine can actually stop for a couple of seconds in routine intervals, which might be unwanted as it makes analysis difficult. One can set a threshold to ignore microstops that are smaller than a configurable threshold (usually like 1-2 seconds).
MinimumRunningTimeInSeconds: Same logic if the machine is running for a couple of seconds only. With this configurable threshold, small run-times can be ignored. These can happen, for example, during the changeover phase.
ThresholdForNoShiftsConsideredBreakInSeconds: If no shift was planned, an UnknownStop will always be classified as a NoShift state. Some companies move smaller NoShift’s into their category called “Break” and move them either into Availability or Performance.
LowSpeedThresholdInPcsPerHour: For a simplified performance calculation, a threshold can be set, and if the machine has a lower speed than this, it could be considered a LowSpeedState and could be categorized into the performance loss bucket.
Language Configuration: The language of the machine states can be configured using the languageCode configuration option (or overwritten in Grafana).
The Shopfloor KPI/Analytics feature of the United Manufacturing Hub provides equipment-based KPIs, configurable dashboards, and detailed analytics for production transparency. Configure OEE calculation and track root causes of low OEE using drill-downs. Easily ingest, process, and analyze data in Grafana.
The Shopfloor KPI / Analytics feature of the United Manufacturing Hub provides a configurable and plug-and-play approach to create “Shopfloor Dashboards” for production transparency consisting of various KPIs and drill-downs.
When should I use it?
If you want to create production dashboards that are highly configurable and can drill down into specific KPIs, the Shopfloor KPI / Analytics feature of the United Manufacturing Hub is an ideal choice. This feature is designed to help you quickly and easily create dashboards that provide a clear view of your shop floor performance.
What can I do with it?
The Shopfloor KPI / Analytics feature of the United Manufacturing Hub allows you to:
Query and visualize
In Grafana, you can:
Calculate the OEE (Overall Equipment Effectiveness) and view trends over time
Availability is calculated using the formula (plannedTime - stopTime) / plannedTime, where plannedTime is the duration of time for all machines states that do not belong in the Availability or Performance category, and stopTime is the duration of all machine states configured to be an availability stop.
Performance is calculated using the formula runningTime / (runningTime + stopTime), where runningTime is the duration of all machine states that consider the machine to be running, and stopTime is the duration of all machine states that are considered a performance loss. Note that this formula does not take into account losses caused by letting the machine run at a lower speed than possible. To approximate this, you can use the LowSpeedThresholdInPcsPerHour configuration option (see further below).
Quality is calculated using the formula good pieces / total pieces
Drill down into stop reasons (including histograms) to identify the root-causes for a potentially low OEE.
List all produced and planned orders including target vs actual produced pieces, total production time, stop reasons per order, and more using job and product tables.
See machine states, shifts, and orders on timelines to get a clear view of what happened during a specific time range.
View production speed and produced pieces over time.
Configure
In the database, you can configure:
Stop Reasons Configuration: Configure which stop reasons belong into which category for the OEE calculation and whether they should be included in the OEE calculation at all. For instance, some companies define changeovers as availability losses, some as performance losses. You can easily move them into the correct category.
Automatic Detection and Classification: Configure whether to automatically detect/classify certain types of machine states and stops:
AutomaticallyIdentifyChangeovers: If the machine state was an unspecified machine stop (UnknownStop), but an order was recently started, the time between the start of the order until the machine state turns to running, will be considered a Changeover Preparation State (10010). If this happens at the end of the order, it will be a Changeover Post-processing State (10020).
MicrostopDurationInSeconds: If an unspecified stop (UnknownStop) has a duration smaller than a configurable threshold (e.g., 120 seconds), it will be considered a Microstop State (50000) instead. Some companies put small unknown stops into a different category (performance) than larger unknown stops, which usually land up in the availability loss bucket.
IgnoreMicrostopUnderThisDurationInSeconds: In some cases, the machine can actually stop for a couple of seconds in routine intervals, which might be unwanted as it makes analysis difficult. One can set a threshold to ignore microstops that are smaller than a configurable threshold (usually like 1-2 seconds).
MinimumRunningTimeInSeconds: Same logic if the machine is running for a couple of seconds only. With this configurable threshold, small run-times can be ignored. These can happen, for example, during the changeover phase.
ThresholdForNoShiftsConsideredBreakInSeconds: If no shift was planned, an UnknownStop will always be classified as a NoShift state. Some companies move smaller NoShift’s into their category called “Break” and move them either into Availability or Performance.
LowSpeedThresholdInPcsPerHour: For a simplified performance calculation, a threshold can be set, and if the machine has a lower speed than this, it could be considered a LowSpeedState and could be categorized into the performance loss bucket.
Language Configuration: The language of the machine states can be configured using the languageCode configuration option (or overwritten in Grafana).
Monitor and maintain your manufacturing processes with real-time Grafana alerts from the United Manufacturing Hub. Get notified of potential issues and reduce downtime by proactively addressing problems.
The United Manufacturing Hub utilizes a TimescaleDB database, which is based
on PostgreSQL. Therefore, you can use the PostgreSQL plugin in Grafana to
implement and configure alerts and notifications.
Why should I use it?
Alerts based on real-time data enable proactive problem detection.
For example, you will receive a notification if the temperature of machine
oil or an electrical component of a production line exceeds limitations.
By utilizing such alerts, you can schedule maintenance, enhance efficiency,
and reduce downtime in your factories.
What can I do with it?
Grafana alerts help you keep an eye on your production and manufacturing
processes. By setting up alerts, you can quickly identify problems,
ensuring smooth operations and high-quality products.
An example of using alerts is the tracking of the temperature
of an industrial oven. If the temperature goes too high or too low, you
will get an alert, and the responsible team can take action before any damage
occurs. Alerts can be configured in many different ways, for example,
to set off an alarm if a maximum is reached once or if it exceeds a limit when
averaged over a time period. It is also possible to include several values
to create an alert, for example if a temperature surpasses a limit and/or the
concentration of a component is too low. Notifications can be sent
simultaneously across many services like Discord, Mail, Slack, Webhook,
Telegram, or Microsoft Teams. It is also possible to forward the alert with
SMS over a personal Webhook. A complete list can be found on the
Grafana page
about alerting.
How can I use it?
Follow this tutorial to set up an alert.
Alert Rule
When creating an alert, you first have to set the alert rule in Grafana. Here
you set a name, specify which values are used for the rule, and
when the rule is fired. Additionally, you can add labels for your rules,
to link them to the correct contact points. You have to use SQL to select the
desired values.
To add a new rule, hover over the bell symbol on the left and click on Alert rules.
Then click on the blue Create alert rule button.
Choose a name for your rule.
In the next step, you need to select and manipulate the value that triggers your alert and declare the function for the alert.
Subsection A is, by default the selection of your values: You can use the Grafana builder for this, but it is not useful, as it cannot select a time interval even though there is a selector for it. If you choose, for example, the last 20 seconds, your query will select values from hours ago. Therefore, it is necessary to use SQL directly. To add command manually, switch to Code in the right corner of the section.
First, you must select the value you want to create an alert for. In the United Manufacturing Hub’s data structure, a process value is stored in the table tag. Unfortunately Grafana cannot differentiate between different values of the same sensor; if you select the ConcentrationNH3 value from the example and more than one of the selected values violates your rule in the selected time interval, it will trigger multiple alerts. Because Grafana is not able to tell the alerts apart, this results in errors. To solve this, you need to add the value "timestamp" to the Select part. So the first part of the SQL command is: SELECT value, "timestamp".
The source is tag, so add FROM tag at the end.
The different values are distinguished by the variable name in the tag, so add WHERE name = '<key-name>' to select only the value you need. If you followed Get Started guide, you can use temperature as the name.
Since the selection of the time interval in Grafana is not working, you must add this manually as an addition to the WHERE command: AND "timestamp" > (NOW() - INTERVAL 'X seconds'). X is the number of past seconds you want to query. It’s not useful to set X to less than 10 seconds, as this is the fastest interval Grafana can check your rule, and you might miss values.
In subsection B, you need to reduce the values to numbers, Grafana can work with. By default, Reduce will already be selected. However, you can change it to a different option by clicking the pencil icon next to the letter B. For this example, we will create an upper limit. So selecting Max as the Function is the best choice. Set Input as A (the output of the first section) and choose Strict for the Mode. So subsection B will output the maximum value the query in A selects as a single number.
In subsection C, you can establish the rule. If you select Math, you can utilize expressions like $B > 120 to trigger an alert when a value from section B ($B means the output from section B) exceeds 50. In this case, only the largest value selected in A is passed through the reduce function from B to C. A simpler way to set such a limit is by choosing Threshold instead of Math.
To add more queries or expressions, find the buttons at the end of section two and click on the desired option. You can also preview the results of your queries and functions by clicking on Preview and check if they function correctly and fire an alert.
Define the rule location, the time interval for rule checking, and the duration for which the rule has to be broken before an alert is triggered.
Select a name for your rule’s folder or add it to an existing one by clicking the arrow. Find all your rules grouped in these folders on the Alert rules page under Alerting.
An Evaluation group is a grouping of rules, which are checked after the same time interval. Creating a new group requires setting a time interval for rule checking. The minimum interval from Grafana is ten seconds.
Specify the duration the rule must be violated before triggering the alert. For example, with a ten-second check interval and a 20-second duration, the rule must be broken twice in a row before an alert is fired.
Add details and descriptions for your rule.
In the next step, you will be required to assign labels to your alert, ensuring it is directed to the appropriate contacts. For example, you may designate a label team with alertrule1: team = operator and alertrule2: team = management. It can be helpful to use labels more than once, like alertrule3: team = operator, to link multiple alerts to a contact point at once.
Your rule is now completed; click on Save and Exit on the right upper corner, next to section one.
Contact Point
In a contact point you create a collection of addresses and services that
should be notified in case of an alert. This could be a Discord channel or
Slack for example. When a linked alert is triggered, everyone within the
contact point receives a message. The messages can be preconfigured and are
specific to every service or contact. The following steps shall be done to create a contact point.
Navigate to Contact points, located at the top of the Grafana alerting page.
Click on the blue + Add contact point button.
Now, you should be able to see setting page. Choose a name for your contact point.
Pick the receiving service; in this example, Discord.
Generate a new Webhook in your Discord server (Server Settings ⇒ Integrations ⇒ View Webhooks ⇒ New Webhook or create Webhook). Assign a name to the Webhook and designate the messaging channel. Copy the Webhook URL from Discord and insert it into the corresponding field in Grafana. Customize the message to Discord under Optional Discord settings if desired.
If you need, add more services to the contact point, by clicking + Add contact point integration.
Save the contact point; you can see it in the Contact points list, below the grafana-default-email contact point.
Notification Policies
In a notification policy, you establish the connection of a contact point
with the desired alerts. To add the notification policy, you need to do the following steps.
Go to the Notification policies section in the Grafana alerting page, next to the Contact points.
Select + New specific policy to create a new policy, followed by + Add matcher to choose the label and value from the alert (for example team = operator). In this example, both alert1 and alert3 will be forwarded to the associated contact point. You can include multiple labels in a single notification policy.
Choose the contact point designated to receive the alert notifications. Now, the inputs should be like in the picture.
Press Save policy to finalize your settings. Your new policy will now be displayed in the list.
Mute Timing
In case you do not want to receive messages during a recurring time
period, you can add a mute timing to Grafana. You can set up a mute timing in the Notification policies section.
Select + Add mute timing below the notification policies.
Choose a name for the mute timing.
Specify the time during which notifications should not be forwarded.
Time has to be given in UTC time and formatted as HH:MM. Use 06:00 instead of 6:00 to avoid an error in Grafana.
You can combine several time intervals into one mute timing by clicking on the + Add another time interval button at the end of the page.
Click Submit to save your settings.
To apply the mute timing to a notification policy, click Edit on the right side of the notification policy, and then select the desired mute timing from the drop-down menu at the bottom of the policy. Click on Save Policy to apply the change.
Silence
You can also add silences for a specific time frame and labels, in case
you only want to mute alerts once. To add a silence, switch to the Silences section, next to Notification policies.
Click on + Add Silence.
Specify the beginning for the silence and its duration.
Select the labels and their values you want silenced.
If you need, you can add a comment to the silence.
Click the Submit button at the bottom of the page.
What are the limitations?
It can be complicated to select and manipulate the desired values to create
the correct function for your application. Grafana cannot
differentiate between data points of the same source. For example, you
want to make a temperature threshold based on a single sensor.
If your query selects the last three values and two of them are above the
threshold, Grafana will fire two alerts which it cannot tell apart.
This results in errors. You have to configure the rule to reduce the selected
values to only one per source to avoid this.
It can be complicated to create such a specific rule with this limitation, and
it requires some testing.
Another thing to keep in mind is that the alerts can only work with data from
the database. It also does not work with the machine status; these values only
exist in a raw, unprocessed form in TimescaleDB and are not processed through
an API like process values.
Whether you have a bare metal server, and edge device, or a virtual machine,
you can easily provision the whole United Manufacturing Hub.
Choose to deploy only the Data Infrastructure on an existing OS, or provision
the entire Device & Container Infrastructure, OS included.
What can I do with it?
You can leverage our custom iPXE bootstrapping process to install the flatcar
operating system, along with the Device & Container Infrastructure and the
Data Infrastructure.
If you already have an operating system installed, you can use the Management
Console to provision the Data Infrastructure on top of it. You can also choose
to use an existing UMH installation and only connect it to the Management
Console.
How can I use it?
If you need to install the operating system from scratch, you can follow the
Flatcar Installation guide,
which will help you to deploy the default version of the United Manufacturing
Hub.
Contact our Sales Team to get help on
customizing the installation process in order to fit your enterprise needs.
If you already have an operating system installed, you can follow the
Getting Started guide to provision the Data
Infrastructure and setup the Management Companion agent on your system.
What are the limitations?
Provisioning the Device & Container Infrastructure requires manual interaction
and is not yet available from the Management Console.
ARM systems are not supported.
Where to get more information?
The Get Started! guide assists you to set up
the United Manufacturing Hub.
Monitor and manage both the Data and the Device & Container Infrastructures using the Management Console.
The Management Console supports you to monitor and manage the Data Infrastructure
and the Device & Container Infrastructure.
When should I use it?
Once initial deployment of the United Manufacturing Hub is completed, you can
monitor and manage it using the Management Console. If you have not deployed yet,
navigate to the Get Started! guide.
What can I do with it?
You can monitor the statuses of the following items using the Management Console:
Modules: A Module refers to a grouped set of related Kubernetes components
like Pods, StatefulSets, and Services. It provides a way to monitor and manage
these components as a single unit.
System:
Resource Utilization: CPU, RAM, and DISK usages.
OS information: the used operating system, kernel version, and instruction
set architecture.
Datastream: the rate of Kafka/TimescaleDB messages per second, the health of both connections and data sources.
Kubernetes: the number of error events and the deployed management
companion’s and UMH’s versions.
In addition, you can check the topic structure used by data sources and the
corresponding payloads.
Moreover, you can create a new connection and initialize the created connection to
deploy a data source.
How can I use it?
From the Component View, in the overview tab, you can click and open each status on this tab.
The Connection Management tab shows the status of all the instance’s connections and their associated
data sources. Moreover, you can create a new connection, as well as initialize them.
Read more about the Connection Management in the Connectivity section.
The Tag Browser provides a comprehensive view of the tag structure, allowing automation engineers to
manage and navigate through all their tags without concerning themselves with underlying technical complexities,
such as topics, keys or payload structures.
Tags typically represent variables associated with devices in an ISA-95 model.
For instance, it could represent a temperature reading from a specific sensor or a status indication from
a machine component. These tags are transported through various technical methods across the Unified
Namespace (UNS) into the database. This includes organizing them within a folder structure or embedding them
as JSON objects within the message payload. Tags can be sent into the same topic or utilizing various sub-topics.
Due to the nature of MQTT and Kafka, the topics may differ, but the following formula applies:
MQTT Topic = Kafka topic + Kafka Key
The Kafka topic and key depend on the configured merge point, read more about it
here.
Presently, removing a UMH instance from the Management Console is not supported.
After overwriting an instance, the old one will display an offline status.
Where to get more information?
The Get Started! guide assists you to set up
the United Manufacturing Hub.
Understand the purpose and features of the UMH Lite, as well as the differences between UMH Lite and UMH Classic.
If you are already using Unified Namespace, or have a Kafka / MQTT broker, you might want to try out the basic features of UMH. For this purpose, the UMH Lite installation is available.
When should I use it?
If you want the full-featured UMH experience, we recommend installing the Classic version. This version provides a comprehensive suite of features, including analytics, data visualization, message brokers, alerting, and more. Below, you can see a comparison of the features between the two versions.
What can I do with it?
Differences between UMH Classic and Lite
Feature
Classic
Lite
Connectivity
OPC UA
✓
✓
Node-RED
✓
Data Infrastructure
Historian
✓
Analytics
✓
Data Visualization
✓
UNS (Kafka and MQTT)
✓
Alerting
✓
UMH Data Model v1
✓
✓
Tag Browser for your UNS
✓
Device & Container Infrastructure
Network Monitoring
✓
✓
Connect devices and add protocol converters
You can connect external devices like a PLC with an OPC UA server to a running UMH Lite instance and contextualize the data from it with a protocol converter.
For contextualization, you have to use the UMH Data Model v1.
Send data to your own infrastructure
All the data that your instance is gathering is sent to your own data infrastructure. You can configure a target MQTT broker in the instance settings by clicking on it in the Management Console.
Monitor your network health
By using the UMH Lite in conjunction with the Management Console, you can spot errors in the network. If a connection is faulty, the Management Console will mark it.
How can I use it?
To add a new UMH Lite instance, simply follow the regular installation process and select UMH Lite instead of UMH Classic. You can follow the next steps in the linked guide to learn how to connect devices and add a protocol converter.
Convert to UMH Classic
Should you find the UMH Lite insufficient and require the features offered by UMH Classic, you can upgrade through the Management Console. To convert a UMH Lite instance to a UMH Classic instance:
Go to the Management Console.
Navigate to Component View.
Select the instance from the list.
Click on ‘Instance Settings’.
You will find an option to convert your instance to Classic.
This change will preserve the configurations of your devices and protocol converters: Their data continues to be forwarded to your initial MQTT broker, while also becoming accessible within your new Unified Namespace and database.
Any protocol converters introduced post-upgrade will also support the original MQTT broker as an additional output. You can manually remove the original MQTT broker as an output after the upgrade. Once removed, data will no longer be forwarded to the initial MQTT broker.
What are the limitations?
The UMH Lite is a very basic version and only offers you the gathering and contextualization of your data as well as the monitoring of the network. Other features like a historian, data visualization, and a Unified Namespace are only available by using the UMH Classic.
Additionally, converting to a UMH Classic requires an SSH connection, similar to what is needed during the initial installation.
Read about our Data Model to keep your data organized and contextualized.
2.3.4 - Layered Scaling
Efficiently scale your United Manufacturing Hub deployment across edge devices and servers using Layered Scaling.
Layered Scaling is an architectural approach in the United Manufacturing Hub that enables efficient scaling of your
deployment across edge devices and servers. It is part of the Plant centric infrastructure
, by dividing the processing workload across multiple layers or tiers, each
with a specific set of responsibilities, Layered Scaling allows for better management of resources,
improved performance, and easier deployment of software components.
Layered Scaling follows the standard IoT infrastructure, by additionally connection a lot of IoT-devices typically via MQTT.
When should I use it?
Layered Scaling is ideal when:
You need to process and exchange data close to the source for latency reasons and independence from internet and
network outages. For example, if you are taking pictures locally, analyzing them using machine learning, and then
scrapping the product if the quality is poor. In this case, you don’t want the machine to be idle if something happens
in the network. Also, it would not be acceptable for a message to arrive a few hundred milliseconds later, as the
process is quicker than that.
High-frequency data might be useful to not send to the “higher” instance and store there. It can put unnecessary
stress on those instances. You have an edge device that takes care of it. For example, you are taking and processing
images (e.g., for quality reasons) or using an accelerometer and microphone for predictive maintenance reasons on the
machine and do not want to send data streams with 20 kHz (20,000 times per second) to the next instance.
Organizational reasons. For the OT person, it might be better to configure the data contextualization using Node-RED
directly at the production machine. They could experiment with it, configure it without endangering other machines,
and see immediate results (e.g., when they move the position of a sensor). If the instance is “somewhere in IT,”
they may feel they do not have control over it anymore and that it is not their system.
What can I do with it?
With Layered Scaling in the United Manufacturing Hub, you can:
Deploy minimized versions of the Helm Chart on edge devices, focusing on specific features required for that
environment (e.g., without the Historian and Analytics features enabled, but with the IFM retrofitting feature using
sensorconnect, with the barcodereader retrofit feature using
barcodereader, or with the data connectivity via Node-RED feature enabled).
Seamlessly communicate between edge devices, on-premise servers, and cloud instances using the kafka-bridge
microservice, allowing data to be buffered in between in case the internet or network connection drops.
Allow plant-overarching analysis / benchmarking, multi-plant kpis, connections to enterprise-IT, etc..
We typically recommend sending only data processed by our API factoryinsight.
How can I use it?
To implement Layered Scaling in the United Manufacturing Hub:
Deploy a minimized version of the Helm Chart on edge devices, tailored to the specific features required for that
environment. You can either install the whole version using flatcar and then disable functionalities you do not need,
or use the Management Console. If the feature is not available in the Management Console, you could try asking nicely
in the Discord and we will, can provide you with a token you can enter during the flatcar installation, so that your
edge devices are pre-configured depending on your needs (incl. demilitarized zones, multiple networks, etc.)
Deploy the full Helm Chart with all features enabled on a central instance, such as a server.
Configure the Kafka Bridge microservice to transmit data from the edge devices to the central instance for further
processing and analysis.
For MQTT connections, you can just connect external devices via MQTT, and it will land up in kafka directly. To connect
on-premise servers with the cloud (plant-overarching architecture), you can use kafka-bridge or write service in benthos
or Node-RED that regularly fetches data from factoryinsight and pushes it into your cloud instance.
What are the limitations?
Be aware that each device increases the complexity over the entire system. We recommend using the
Management Console to manage them centrally.
Because Kafka is used to reliably transmit messages from the edge devices to the server, and it struggles with devices
repeatedly going offline and online again, ethernet connections should be used. Also, the total amount of edge devices
should not “escalate”. If you have a lot of edge devices (e.g., you want to connect each PLC), we recommend connecting
them via MQTT to an instance of the UMH instead.
Where to get more information?
Learn more about the United Manufacturing Hub’s architecture by visiting our architecture page.
For more information about the Helm Chart and how to deploy it, refer to the Helm Chart documentation.
To get an overview of the microservices in the United Manufacturing Hub, check out the microservices documentation.
2.3.5 - Upgrading
Discover how to keep your UMH Instance’s up-to-date.
Upgrading is a vital aspect of maintaining your United Manufacturing Hub (UMH)
instance. This feature ensures that your UMH environment stays current, secure,
and optimized with the latest enhancements. Explore the details below to make
the most of the upgrading capabilities.
When Should I Use It?
Upgrade your UMH instance whenever a new version is released to access the
latest features, improvements, and security enhancements. Regular upgrades
are recommended for a seamless experience.
What Can I Do With It?
Enhance your UMH instance in the following ways:
Keep it up-to-date with the latest features and improvements.
Enhance security and performance.
Take advantage of new functionalities and optimizations introduced in each
release.
How Can I Use It?
To upgrade your UMH instance, follow the detailed instructions provided in the
Upgrading Guide.
What Are The Limitations?
As of now, the upgrade process for the UMH stack is not integrated into the
Management Console and must be performed manually.
Ensure compatibility with the recommended prerequisites before initiating an
upgrade.
3 - Concepts
The Concepts section helps you learn about the parts of the United
Manufacturing Hub system, and helps you obtain a deeper understanding of
how it works.
3.1 - Security
3.1.1 - Management Console
Concepts related to the security of the Management Console.
The web-based nature of the Management Console means that it is exposed to the
same security risks as any other web application. This section describes the
measures that we adopt to mitigate these risks.
Encrypted Communication
The Management Console is served over HTTPS, which means that all communication
between the browser and the server is encrypted. This prevents attackers from
eavesdropping on the communication and stealing sensitive information such as
passwords and session cookies.
Cyphered Messages
This feature is currently in development and is subject to change.
Other than the standard TLS encryption provided by HTTPS, we also provide an
additional layer of encryption for the messages exchanged between the Management
Console and your UMH instance.
Every action that you perform on the Management Console, such as creating a new
data source, and every information that you retrieve, such as the messages in
the Unified Namespace, is encrypted using a secret key that is only known to
you and your UMH instance. This ensures that no one, not even us, can see, read
or reverse engineer the content of these messages.
The process we use (which is now patent pending) is simple yet effective:
When you create a new user on the Management Console, we generate a new
private key and we encrypt it using your password. This means that only you
can decrypt it.
The encrypted private key and your hashed password are stored in our database.
When you login to the Management Console, the encrypted private key associated
with your user is downloaded to your browser and decrypted using your
password. This ensures that your password is never sent to our server, and
that the private key is only available to you.
When you add a new UMH instance to the Management Console, it generates a
token that the Management Companion (aka your instance) will use to
authenticate itself. This token works the same way as your user password: it
is used to encrypt a private key that only the UMH instance can decrypt.
The instance encrypted private key and the hashed token are stored in our
database. A relationship is also created between the user and the instance.
All the messages exchanged between the Management Console and the UMH
instance are encrypted using the private keys, and then encrypted again using
the TLS encryption provided by HTTPS.
The only drawback to this approach is that, if you forget your password, we
won’t be able to recover your private key. This means that you will have to
create a new user and reconfigure all your UMH instances. But your data will
still be safe and secure.
However, even though we are unable to read any private key, there is some information
that we can inevitably see:
IP addresses of the devices using the Management Console and of the UMH instances
that they are connected to
The time at which the devices connect to the Management Console
Amount of data exchanged between the devices and the Management Console (but
not its content)
4 - Data Contracts / API
This page describes how messages flow in the UMH, which message goes where, how it has to be formatted and how you can create your own structures.
What are Data Contracts
Data Contracts are agreements that define how data is structured, formatted, and
managed when different parts of a Unified Namespace (UNS) architecture
communicate. They cover metadata, data models, and service levels to ensure that
all systems work together smoothly and reliably.
Simply put, data contracts specify where a message is going, the format it must
follow, how it’s delivered, and what happens when it arrives - all based on
agreed-upon rules and services. It is similar to an API: you send a specific message, and
it triggers a predefined action. For example, sending data
to _historian automatically stores it in TimescaleDB,
just like how a REST API’s POST endpoint would store data
in its database.
Example Historian
To give you a simple example, just think about the _historian schema. Perhaps
without realizing it, you have already used the Historian Data Contract by using
this schema.
Whenever you send a message to a topic that contains the _historian schema via
MQTT, you know that it will be bridged to Kafka and end up in TimescaleDB.
You could also send it directly into Kafka, and you know that it gets
bridged to MQTT as well.
But you also know that you have to follow the correct payload and topic
structure that we as UMH have defined. If there are any issues like a missing
timestamp in the message, you know that you could look them up in the
Management Console.
These rules ensure that the data can be written into the intended database
tables without causing errors, and that the data can be read by other programs,
as it is known what data and structure to expect.
For example, the timestamp is an easy way to avoid errors by making each message
idempotent (can be safely processed multiple times without changing the result).
Each data point associated with a tag is made completely unique by its timestamp, which is
critical because messages are sent using “at least once” semantics, which can
lead to duplicates. With idempotency, duplicate messages are ignored, ensuring
that each message is only stored once in the database.
If you want a lot more information and really dive into the reasons for this
approach, we recommend our article about
Data Modeling in the UNS
on our Learn page.
Rules of a Data Contract
Data Contracts can enforce a number of rules. This section provides an overview
of the two rules that are enforced by default. The specifics can vary between
Data Contracts; therefore, detailed information about the
Historian Data Contract
and Custom Data Contracts
is provided on their respective pages.
Topic Structure
As mentioned in the example, messages in the UMH must follow our ISA-95
compliant structure in order to be processed. The structure itself can be
divided into several sections.
flowchart LR
umh --> v1
v1 --> enterprise
enterprise -->|Optional| site
site -->|Optional| area
area -->|Optional| productionLine
productionLine -->|Optional| workCell
workCell -->|Optional| originID
originID -.-> _schema["_schema (Ex: _historian, _custom)"]
_schema -->_opt["Schema dependent context"]
classDef mqtt fill:#00dd00,stroke:#333,stroke-width:4px;
class umh,v1,enterprise,_schema mqtt;
classDef optional fill:#77aa77,stroke:#333,stroke-width:4px;
class site,area,productionLine,workCell,originID optional;
enterprise -.-> _schema
site -.-> _schema
area -.-> _schema
productionLine -.-> _schema
workCell -.-> _schema
You can check if your topics are correct in the validator below.
Topic validator
Prefix
The first section is the mandatory prefix: umh.v1. It ensures that the
structure can evolve over time without causing confusion or compatibility
problems.
Location
The next section is the Location, which consists of six parts:
enterprise.site.area.productionLine.workCell.originID.
You may be familiar with this structure as it is used by your instances and
connections. Here the enterprise field is mandatory.
When you create a Protocol Converter, it uses the Location of the instance and
the connection to prefill the topic, but you can add the unused ones or change
the prefilled parts.
Schemas
The schema, for example _historian, tells the UMH which data contract to
apply to the message. It is specified after the Location section and is
highlighted with an underscore to make it parsable for the UMH
and to clearly separate it from the location fields.
There is currently only one default schema in the UMH: _historian; for more
detailed information, see the
Historian Data Contract
page.
Depending on the schema used, the next parts of the topic may differ. For
example, in the `_historian’ schema, you can either attach your payload
directly or continue to group tags.
Allowed Characters
Topics can consist of any letters (a-z, A-Z), numbers (0-9), and the
symbols (- & _). Note that the _ cannot be used as the first character in
the Location section.
Be careful to avoid ., +, #, or / as these are
special symbols in Kafka or MQTT.
Note that our topics are case-sensitive, so umh.v1.ACMEIncorporated is
not the same as umh.v1.acmeincorporated.
Payload Structure
A Data Contract can include payload rules. For example, in the Historian Data
Contract, you must include a timestamp in milliseconds and a key-value pair.
These requirements are unique to each Data Contract.
Components of a Data Contract
In addition to the rules, a Data Contract consists of individual components.
The specifics can vary between Data Contracts; therefore, detailed information
about the Historian Data Contract
and Custom Data Contracts
is provided on their respective pages.
Data Flow Components
As the name implies, a Data Flow Component manages the movement and
transformation of data within the Unified Namespace architecture.
Data Flow Components can be of three different types: Protocol Converter, Data
Bridge, or Custom Data Flow Component. All are based on
BenthosUMH.
Protocol Converter
You have probably already created a Protocol Converter and are familiar with
its purpose: get data from different sources into your instances. You format
the data into the correct payload structure and send it to the correct topics.
When you add a Protocol Converter, the Management Console uses the configuration
of the underlying Connection and instance to automatically generate most of the
configuration for the Protocol Converter.
Data Bridges
Data Bridges are placed between two components of the Unified Namespace, such as
Kafka and MQTT, and allow messages to be passed between them. The default Data
Bridges are the two between MQTT and Kafka for the _historian schema, and the
bridge between Kafka and the database. Each Data Bridge is unidirectional and
specific to one schema.
Custom Data Flow Components
To meet everyone’s needs and enable stream processing, you can add Custom Data
Flow Components (creative naming is our passion). Unlike Protocol Converters or
Data Bridges, you have full control over their configuration, which makes them
incredibly versatile, but also complicated to set up. Therefore, they must be
manually enabled by switching to Advanced Mode in the Management Console Settings.
Other Data Contracts
Data Contracts can build on existing contracts. For example, if you use a Custom
Data Contract to automatically calculate KPIs, you can send the raw data to
_historian, process it with a Custom Data Flow Component, and publish it to a
new schema. The new Data Contract uses the Historian to collect data from the
machines and store it in the database.
4.1 - Historian Data Contract
This page is a deep dive of the Historian Data Contract of the UMH including the configuration and rules associated to it.
This section focuses on the specific details and configurations of the
Historian Data Contract. If you are not familiar with Data Contracts, you
should first read the
Data Contracts / API page.
Historian
The purpose of the Historian Data Contract is to govern the flow of data from
the Protocol Converter to the database.
It enforces rules for the structure of payloads and topics, and provides the
necessary infrastructure to bridge data in the Unified Namespace and write it
to the database.
This ensures that data is only stored in a format accepted by the database,
and makes it easier to integrate services like Grafana because the data
structure is already known.
It also ensures that each message is idempotent (can be safely processed
multiple times without changing the result), by making each message within a
tag completely unique by its timestamp.
This is critical because messages are sent using “at least once” semantics,
which can lead to duplicates.
With idempotency, duplicate messages are ignored, ensuring that each message
is only stored once in the database.
Topic Structure in the Historian Data Contract
flowchart LR
umh --> v1
v1 --> enterprise
enterprise -->|Optional| site
site -->|Optional| area
area -->|Optional| productionLine
productionLine -->|Optional| workCell
workCell -->|Optional| originID
originID -.-> _historian
_historian -->_tagGroups
classDef mqtt fill:#00dd00,stroke:#333,stroke-width:4px;
class umh,v1,enterprise,_historian mqtt;
classDef optional fill:#77aa77,stroke:#333,stroke-width:4px;
class site,area,productionLine,workCell,originID optional;
enterprise -.-> _historian
site -.-> _historian
area -.-> _historian
productionLine -.-> _historian
workCell -.-> _historian
The prefix and Location of the topic in the Historian Data Contract follows
the same rules as already described on the general
Data Contracts
page.
Prefix
The first section is the mandatory prefix: umh.v1..
It ensures that the structure can evolve over time without causing confusion or
compatibility problems.
Location
The next section is the Location, which consists of six parts:
enterprise.site.area.productionLine.workCell.originID.
You may be familiar with this structure as it is used by your instances and
connections. Here, the enterprise field is mandatory.
When you create a Protocol Converter, it uses the Location of the instance and
the connection to prefill the topic, but you can add the unused ones or change
the prefilled parts.
Schema: _historian
The only schema in the Historian Data Contract is _historian.
Without it, your messages will not be processed.
Tag groups
In addition to the Location, you can also use tag groups.
A tag group is just an additional part after the schema:
In the tag browser, a tag group will look like any field in the Location, except
that it is located after the schema.
Example
Tag groups can be useful for adding context to your tags or for keeping track
of them in the tag browser. For example, you might use them to categorize the
sensors on a CNC mill.
The Historian Data Contract requires that your messages be a JSON file with a
specific structure and include a timestamp and at least one tag with a value,
both as a key-value pair. The most basic message looks like this
{
"timestamp_ms": 1732280023697,
"tagname": 42}
The timestamp must be called "timestamp_ms" and contain the timestamp in
milliseconds. The value of the tag can be either a number "tagname": 123 or a
string "tagname": "string". The "tagname" is used in the tag browser or for
Grafana.
It is also possible to include multiple tags in a single payload.
The Historian Data Contract enables data acquisition and processing through the
use of Protocol Converters and the automatic deployment of three Data Bridges.
Data Bridges
There are three Data Bridges in the Historian Data Contract, which are
automatically created and configured when the instance is created.
The first bridge routes messages from Kafka to MQTT, the second from MQTT to Kafka.
The third Data Bridge bridges messages from Kafka to the TimescaleDB database.
The Data Bridges are responsible for validating the topic and payload, and
adding error logs in case a message is not valid.
Their configurations are not editable in the Management Console.
Protocol Converters
The easiest way to get data into your UNS is to use a Protocol Converter.
If you want to learn how to do this, you can follow our Get Started guide.
The configuration of a Protocol Converter consists of three sections:
Input: Here you specify the address, protocol used, authentication, and
the “location” of the data on the connected device. This could be the NodeID on
an OPC UA PLC.
Processing: In this section, you manipulate the data, build the
timestamped payload, and specify the topic.
Output: The output is completely auto-generated and cannot be modified.
The data is always sent to the instance’s Kafka broker.
Information specific to the selected protocol and section can be found by clicking on the vertical PROTOCOL CONVERTER button on the right edge of the window.
Verified Protocols
Our Protocol Converters are compatible with a long list of protocols.
The most important ones are considered verified by us; look for the check mark
next to the protocol name when selecting the protocol on the Edit Protocol
Converter page in the Management Console.
If you are using one of the verified protocols, many of the fields will be
populated automatically based on the underlying connection and instance.
The input section uses the address of the connection and adds prefixes and
suffixes as necessary. If you are using OPC UA, the username and password are
autofilled. The preconfigured processing section will use the location of the
instance and the connection to build the topic and use the name of the original
tag as the tag name. It will also automatically generate a payload with a
timestamp and the value of the incoming message.
If the preconfiguration does not meet your needs, you can change it.
Database
We use TimescaleDB as the database in the UMH. By default, only tags from the
Historian Data Contract are written to the database.
Our database for the Historian Data Contract consists of three tables. We chose
this layout to allow easy lookups based on the asset, while maintaining
separation between data and names. The separation into tag and tag_string
prevents accidental lookups of the wrong data type, which could break queries
such as aggregations or averages.
erDiagram
asset {
int id PK "SERIAL PRIMARY KEY"
text enterprise "NOT NULL"
text site "DEFAULT '' NOT NULL"
text area "DEFAULT '' NOT NULL"
text line "DEFAULT '' NOT NULL"
text workcell "DEFAULT '' NOT NULL"
text origin_id "DEFAULT '' NOT NULL"
}
tag {
timestamptz timestamp "NOT NULL"
text name "NOT NULL"
text origin "NOT NULL"
int asset_id FK "REFERENCES asset(id) NOT NULL"
real value
}
tag_string {
timestamptz timestamp "NOT NULL"
text name "NOT NULL"
text origin "NOT NULL"
int asset_id FK "REFERENCES asset(id) NOT NULL"
text value
}
asset ||--o{ tag : "id"
asset ||--o{ tag_string : "id"
An asset to us is the unique combination of the parts of the Location:
enterprise, site, area, line, workcell, and origin_id. Each asset
has an id that is automatically assigned.
All keys except id and enterprise are optional.
The example below shows how the table might look.
A new asset is added to the bottom of the table.
id
enterprise
site
area
line
workcell
origin_id
1
acme-corporation
2
acme-corporation
new-york
3
acme-corporation
london
north
assembly
4
stark-industries
berlin
south
fabrication
cell-a1
3002
5
stark-industries
tokyo
east
testing
cell-b3
3005
6
stark-industries
paris
west
packaging
cell-c2
3009
7
umh
cologne
office
dev
server1
sensor0
8
cuttingincorporated
cologne
cnc-cutter
tag
This table is a Timescale hypertable.
These tables are optimized to hold a large amount of data roughly sorted by time.
For example, we send data to umh/v1/cuttingincorporated/cologne/cnc-cutter/_historian/head using the following JSON:
All tags have the same asset_id because each topic contains the same Location.
The tag groups are not part of the asset and are prefixed to the tag name.
The origin is a placeholder for a later feature, and currently defaults to unknown.
tag_string
This table is similar to the tag table, but is used for string data.
For example, a CNC cutter could also output the G-code being processed.
Posting this message to the topic from above would result in this entry:
timestamp
name
origin
asset_id
value
1670001247568
g-code
unknown
8
G01 X10 Y10 Z0
4.2 - Custom Data Contracts
In addition to the standard data contracts provided, you can add your own.
This section focuses on Custom Data Contracts.
If you are not familiar with Data Contracts, you should first read the
Data Contracts / API.
We are currently working on a blog post that will explain the concept of Custom Data Contracts in more detail.
Why Custom Data Contracts
The only Data Contract that exists per default in the UMH is the Historian Data Contract.
Custom Data Contracts let you add additional functionalities to your UMH, like automatically calculate KPIs or further processing of data.
Example of a custom Data Contract
One example for a Custom Data Contract is the automated interaction of MES and PLCs.
Every time a machine stops, the latest order ID from the MES needs to be automatically written into the PLC.
We begin by utilizing the existing _historian data contract to continuously send and store the latest order ID from the MES in the UNS.
Additionally, a custom schema (for example, _action) is required to handle action requests and responses, enabling commands like writing data to the PLC.
The next step is to implement Protocol Converters to facilitate communication between systems.
For ingoing messages, a Protocol Converter fetches the latest order ID from the MES and publishes it to the UNS using the _historian data contract.
For outgoing messages, another Protocol Converter listens for action requests in the manually added _action data contract and executes them by getting the last order ID from the UNS and writing the order ID to the PLC.
Protocol Converters can be seen as an interface between the UMH and external systems.
Finally, we have to set up a Custom Data Flow Component as a stream processor that monitors the UNS for specific conditions, such as a machine stoppage. When such a condition is detected, it generates an action request in the _action data contract for the output protocol converter to process.
Additionally, we have to add Data Bridges for the _action schema.
In these you enforce a specific topic and payload structure.
The combination of the Historian Data Contract, the additional _action schema, custom Data Bridges, the two Protocol Converters and the stream processor and enforcement of payload and topic structure from this new Data Contract.
Topic Structure in Custom Data Contracts
The topic structure follows the same rules as specified in the Data Contracts / API page, until the schema-dependent content.
The schema-dependent content depends on your configuration of the deployed custom Data Bridges.
Add custom schema
More information about custom schemas will be added here when the feature is ready to use.
5 - Architecture
A comprehensive overview of the United Manufacturing Hub architecture,
detailing its deployment, management, and data processing capabilities.
The United Manufacturing Hub is a comprehensive Helm Chart for Kubernetes,
integrating a variety of open source software, including notable third-party
applications such as Node-RED and Grafana. Designed for versatility, UMH is
deployable across a wide spectrum of environments, from edge devices to virtual
machines, and even managed Kubernetes services, catering to diverse industrial
needs.
The following diagram depicts the interaction dynamics between UMH’s components
and user types, offering a visual guide to its architecture and operational
mechanisms.
graph LR
subgraph group1 [United Manufacturing Hub]
style group1 fill:#ffffff,stroke:#47a0b5,color:#47a0b5,stroke-dasharray:5
16["`**Management Console**
Configures, manages, and monitors Data and Device & Container Infrastructures in the UMH Integrated Platform`"]
style 16 fill:#aaaaaa,stroke:#47a0b5,color:#000000
27["`**Device & Container Infrastructure**
Oversees automated, streamlined installation of key software and operating systems`"]
style 27 fill:#aaaaaa,stroke:#47a0b5,color:#000000
50["`**Data Infrastructure**
Integrates every ISA-95 standard layer with the Unified Namespace, adding data sources beyond typical automation pyramid bounds`"]
style 50 fill:#aaaaaa,stroke:#47a0b5,color:#000000
end
1["`fa:fa-user **IT/OT Professional**
Manages and monitors the United Manufacturing Hub`"]
style 1 fill:#dddddd,stroke:#9a9a9a,color:#000000
2["`fa:fa-user **OT Professional / Shopfloor**
Monitors and manages the shopfloor, including safety, automation and maintenance`"]
style 2 fill:#dddddd,stroke:#9a9a9a,color:#000000
3["`fa:fa-user **Business Analyst**
Gathers and analyzes company data to identify needs and recommend solutions`"]
style 3 fill:#dddddd,stroke:#9a9a9a,color:#000000
4["`**Data Warehouse/Data Lake**
Stores data for analysis, on-premise or in the cloud`"]
style 4 fill:#f4f4f4,stroke:#f4f4f4,color:#000000
5["`**Automation Pyramid**
Represents the layered structure of systems in manufacturing operations based on the ISA-95 model`"]
style 5 fill:#f4f4f4,stroke:#f4f4f4,color:#000000
1-. Interacts with the
entire infrastructure .->16
16-. Manages & monitors .->27
16-. Manages & monitors .->50
2-. Access real-time
dashboards from .->50
2-. Works with .->5
3-. Gets and analyzes data from .->4
50-. Is installed on .->27
50-. Provides data to .->4
50-. Provides to and
extracts data from .->5
The Management Console
of the United Manufacturing Hub is a robust web application designed to configure,
manage, and monitor the various aspects of Data and Device & Container
Infrastructures within UMH. Acting as the central command center, it provides a
comprehensive overview and control over the system’s functionalities, ensuring
efficient operation and maintenance. The console simplifies complex processes,
making it accessible for users to oversee the vast array of services and operations
integral to UMH.
Device & Container Infrastructure
The Device & Container Infrastructure
lays the foundation of the United Manufacturing Hub’s architecture, streamlining
the deployment and setup of essential software and operating systems across devices.
This infrastructure is pivotal in automating the installation process, ensuring
that the essential software components and operating systems are efficiently and
reliably established. It provides the groundwork upon which the Data Infrastructure
is built, embodying a robust and scalable base for the entire architecture.
Data Infrastructure
The Data Infrastructure is the heart of
the United Manufacturing Hub, orchestrating the interconnection of data sources,
storage, monitoring, and analysis solutions. It comprises three key components:
Data Connectivity: Facilitates the integration of diverse data sources into
UMH, enabling uninterrupted data exchange.
Unified Namespace (UNS): Centralizes and standardizes data within UMH into
a cohesive model, by linking each layer of the ISA-95 automation pyramid to the
UNS and assimilating non-traditional data sources.
Historian: Stores data in TimescaleDB, a PostgreSQL-based time-series
database, allowing real-time and historical data analysis through Grafana or
other tools.
The UMH Data Infrastructure leverages Industrial IoT to expand the ISA95 Automation
Pyramid, enabling high-speed data processing using systems like Kafka. It enhances
system availability through Kubernetes and simplifies maintenance with Docker and
Prometheus. Additionally, it facilitates the use of AI, predictive maintenance,
and digital twin technologies
Expandability
The United Manufacturing Hub is architecturally designed for high expandability,
enabling integration of custom microservices or Docker containers. This adaptability
allows for users to establish connections with third-party systems or to implement
specialized data analysis tools. The platform also accommodates any third-party
application available as a Helm Chart, Kubernetes resource, or Docker Compose,
offering vast potential for customization to suit evolving industrial demands.
5.1 - Data Infrastructure
An overview of UMH’s Data Infrastructure, integrating and managing diverse data
sources.
The United Manufacturing Hub’s Data Infrastructure is where all data converges.
It extends the ISA95 Automation Pyramid, the usual model for data flow in factory
settings. This infrastructure links each level of the traditional pyramid to the
Unified Namespace (UNS), incorporating extra data sources that the typical automation
pyramid doesn’t include. The data is then organized, stored, and analyzed to offer
useful information for frontline workers. Afterwards, it can be sent to the a data
lake or analytics platform, where business analysts can access it for deeper insights.
It comprises three primary elements:
Data Connectivity:
This component includes an array of tools and services designed
to connect various systems and sensors on the shop floor, facilitating the flow
of data into the Unified Namespace.
Unified Namespace:
Acts as the central hub for all events and messages on the
shop floor, ensuring data consistency and accessibility.
Historian: Responsible
for storing events in a time-series database, it also provides tools for data
visualization, enabling both real-time and historical analytics.
Together, these elements provide a comprehensive framework for collecting,
storing, and analyzing data, enhancing the operational efficiency and
decision-making processes on the shop floor.
graph LR
2["`fa:fa-user **OT Professional / Shopfloor**
Monitors and manages the shopfloor, including safety, automation and maintenance`"]
style 2 fill:#dddddd,stroke:#9a9a9a,color:#000000
4["`**Data Warehouse/Data Lake**
Stores data for analysis, on-premise or in the cloud`"]
style 4 fill:#f4f4f4,stroke:#f4f4f4,color:#000000
5["`**Automation Pyramid**
Represents the layered structure of systems in manufacturing operations based on the ISA-95 model`"]
style 5 fill:#f4f4f4,stroke:#f4f4f4,color:#000000
16["`**Management Console**
Configures, manages, and monitors Data and Device & Container Infrastructures in the UMH Integrated Platform`"]
style 16 fill:#aaaaaa,stroke:#47a0b5,color:#000000
subgraph 50 [Data Infrastructure]
style 50 fill:#ffffff,stroke:#47a0b5,color:#47a0b5
51["`**Unified Namespace**
The central source of truth for all events and messages on the shop floor.`"]
style 51 fill:#aaaaaa,stroke:#47a0b5,color:#000000
64["`**Historian**
Stores events in a time-series database and provides visualization tools.`"]
style 64 fill:#aaaaaa,stroke:#47a0b5,color:#000000
85["`**Connectivity**
Includes tools and services for connecting various shop floor systems and sensors.`"]
style 85 fill:#aaaaaa,stroke:#47a0b5,color:#000000
end
16-. Manages & monitors .->85
85-. Provides
contextualized data .->51
85-. Provides and
extracts data .->5
51-. Provides data .->4
51-. Stores data in a
predefined schema .->64
5<-. Works with .-2
2-. Visualize real-time
dashboards .->64
Learn about the tools and services in UMH’s Data Connectivity for integrating
shop floor systems.
The Data Connectivity module in the United Manufacturing Hub is designed to enable
seamless integration of various data sources from the manufacturing environment
into the Unified Namespace. Key components include:
Node-RED:
A versatile programming tool that links hardware devices, APIs, and online services.
barcodereader:
Connects to USB barcode readers, pushing data to the message broker.
benthos-umh: A specialized version of benthos featuring an OPC UA plugin for
efficient data extraction.
sensorconnect:
Integrates with IO-Link Masters and their sensors, relaying data to the message broker.
These tools collectively facilitate the extraction and contextualization of data
from diverse sources, adhering to the ISA-95 automation pyramid model, and
enhancing the Management Console’s capability to monitor and manage data flow
within the UMH ecosystem.
graph LR
5["`**Automation Pyramid**
Represents the layered structure of systems in manufacturing operations based on the ISA-95 model`"]
style 5 fill:#f4f4f4,stroke:#f4f4f4,color:#000000
16["`**Management Console**
Configures, manages, and monitors Data and Device & Container Infrastructures in the UMH Integrated Platform`"]
style 16 fill:#aaaaaa,stroke:#47a0b5,color:#000000
51["`**Unified Namespace**
The central source of truth for all events and messages on the shop floor.`"]
style 51 fill:#aaaaaa,stroke:#47a0b5,color:#000000
subgraph 85 [Connectivity]
style 85 fill:#ffffff,stroke:#47a0b5,color:#47a0b5
86["`**Node-RED**
A programming tool for wiring together hardware devices, APIs, and online services.`"]
style 86 fill:#aaaaaa,stroke:#47a0b5,color:#000000
87["`**Barcode Reader**
Connects to USB barcode reader devices and pushes data to the message broker.`"]
style 87 fill:#aaaaaa,stroke:#47a0b5,color:#000000
88["`**Sensor Connect**
Reads out IO-Link Master and their connected sensors, pushing data to the message broker.`"]
style 88 fill:#aaaaaa,stroke:#47a0b5,color:#000000
89["`**benthos-umh**
Customized version of benthos with an OPC UA plugin`"]
style 89 fill:#aaaaaa,stroke:#47a0b5,color:#000000
end
16-. Manages & monitors .->89
89-. Provides
contextualized data .->51
86-. Provides
contextualized data .->51
87-. Provides
contextualized data .->51
88-. Provides
contextualized data .->51
89-. Extracts data via OPC UA .->5
86-. Extracts data via S7, and
many more protocols .->5
This microservice is still in development and is not considered stable for production use.
Barcodereader is a microservice that reads barcodes and sends the data to the Kafka broker.
How it works
Connect a barcode scanner to the system and the microservice will read the barcodes and send the data to the Kafka broker.
What’s next
Read the Barcodereader reference
documentation to learn more about the technical details of the Barcodereader
microservice.
5.1.1.2 - Node Red
Node-RED is a programming tool for wiring together
hardware devices, APIs and online services in new and interesting ways. It
provides a browser-based editor that makes it easy to wire together flows using
the wide range of nodes in the Node-RED library.
How it works
Node-RED is a JavaScript-based tool that can be used to create flows that
interact with the other microservices in the United Manufacturing Hub or
external services.
Read the Node-RED reference
documentation to learn more about the technical details of the Node-RED
microservice.
5.1.1.3 - Sensorconnect
Sensorconnect automatically detects ifm gateways
connected to the network and reads data from the connected IO-Link
sensors.
How it works
Sensorconnect continuosly scans the given IP range for gateways, making it
effectively a plug-and-play solution. Once a gateway is found, it automatically
download the IODD files for the connected sensors and starts reading the data at
the configured interval. Then it processes the data and sends it to the MQTT or
Kafka broker, to be consumed by other microservices.
If you want to learn more about how to use sensors in your asstes, check out the
retrofitting section of the UMH Learn
website.
IODD files
The IODD files are used to describe the sensors connected to the gateway. They
contain information about the data type, the unit of measurement, the minimum and
maximum values, etc. The IODD files are downloaded automatically from
IODDFinder once a sensor is found, and are
stored in a Persistent Volume. If downloading from internet is not possible,
for example in a closed network, you can download the IODD files manually and
store them in the folder specified by the IODD_FILE_PATH environment variable.
If no IODD file is found for a sensor, the data will not be processed, but sent
to the broker as-is.
What’s next
Read the Sensorconnect reference
documentation to learn more about the technical details of the Sensorconnect
microservice.
5.1.2 - Unified Namespace
Discover the Unified Namespace’s role as a central hub for shop floor data in
UMH.
The Unified Namespace (UNS) within the United Manufacturing Hub is a vital module
facilitating the streamlined flow and management of data. It comprises various
microservices:
data-bridge:
Bridges data between MQTT and Kafka and between multiple Kafka instances, ensuring
efficient data transmission.
HiveMQ:
An MQTT broker crucial for receiving data from IoT devices on the shop floor.
Redpanda (Kafka):
Manages large-scale data processing and orchestrates communication between microservices.
Redpanda Console:
Offers a graphical interface for monitoring Kafka topics and messages.
The UNS serves as a pivotal point in the UMH architecture, ensuring data from shop
floor systems and sensors (gathered via the Data Connectivity module) is effectively
processed and relayed to the Historian and external Data Warehouses/Data Lakes
for storage and analysis.
graph LR
4["`**Data Warehouse/Data Lake**
Stores data for analysis, on-premise or in the cloud`"]
style 4 fill:#f4f4f4,stroke:#f4f4f4,color:#000000
64["`**Historian**
Stores events in a time-series database and provides visualization tools.`"]
style 64 fill:#aaaaaa,stroke:#47a0b5,color:#000000
85["`**Connectivity**
Includes tools and services for connecting various shop floor systems and sensors.`"]
style 85 fill:#aaaaaa,stroke:#47a0b5,color:#000000
subgraph 51 [Unified Namespace]
style 51 fill:#ffffff,stroke:#47a0b5,color:#47a0b5
52["`**Redpanda (Kafka)**
Handles large-scale data processing and communication between microservices.`"]
style 52 fill:#aaaaaa,stroke:#47a0b5,color:#000000
53["`**HiveMQ**
MQTT broker used for receiving data from IoT devices on the shop floor.`"]
style 53 fill:#aaaaaa,stroke:#47a0b5,color:#000000
54["`**Redpanda Console**
Provides a graphical view of topics and messages in Kafka.`"]
style 54 fill:#aaaaaa,stroke:#47a0b5,color:#000000
55["`**databridge**
Bridges messages between MQTT and Kafka as well as between Kafka and other Kafka instances.`"]
style 55 fill:#aaaaaa,stroke:#47a0b5,color:#000000
end
54-.->52
52<-.->55
55<-.->53
55-. Provides data .->4
52-. Stores data in a
predefined schema .->64
85-. Provides
contextualized data .->53
85-. Provides
contextualized data .->52
Data-bridge is a microservice specifically tailored to adhere to the
UNS
data model. It consumes topics from a message broker, translates them to
the proper format and publishes them to the other message broker.
How it works
Data-bridge connects to the source broker, that can be either Kafka or MQTT,
and subscribes to the topics specified in the configuration. It then processes
the messages, and publishes them to the destination broker, that can be either
Kafka or MQTT.
In the case where the destination broker is Kafka, messages from multiple topics
can be merged into a single topic, making use of the message key to identify
the source topic.
For example, subscribing to a topic using a wildcard, such as
umh.v1.acme.anytown..*, and a merge point of 4, will result in
messages from the topics umh.v1.acme.anytown.foo.bar,
umh.v1.acme.anytown.foo.baz, umh.v1.acme.anytown and umh.v1.acme.anytown.frob
being merged into a single topic, umh.v1.acme.anytown, with the message key
being the missing part of the topic name, in this case foo.bar, foo.baz, etc.
The value of the message is not changed, only the topic and key are modified.
Another important feature is that it is possible to configure multiple data
bridges, each with its own source and destination brokers, and each with its
own set of topics to subscribe to and merge point.
The brokers can be local or remote, and, in case of MQTT, they can be secured
using TLS.
What’s next
Read the Data Bridge reference
documentation to learn more about the technical details of the data-bridge microservice.
5.1.2.2 - Kafka Broker
The Kafka broker in the United Manufacturing Hub is RedPanda,
a Kafka-compatible event streaming platform. It’s used to store and process
messages, in order to stream real-time data between the microservices.
How it works
RedPanda is a distributed system that is made up of a cluster of brokers,
designed for maximum performance and reliability. It does not depend on external
systems like ZooKeeper, as it’s shipped as a single binary.
Read the Kafka Broker reference documentation
to learn more about the technical details of the Kafka broker microservice
5.1.2.3 - Kafka Console
Kafka-console uses Redpanda Console
to help you manage and debug your Kafka workloads effortlessy.
With it, you can explore your Kafka topics, view messages, list the active
consumers, and more.
How it works
You can access the Kafka console via its Service.
It’s automatically connected to the Kafka broker, so you can start using it
right away.
You can view the Kafka broker configuration in the Broker tab, and explore the
topics in the Topics tab.
What’s next
Read the Kafka Console reference documentation
to learn more about the technical details of the Kafka Console microservice.
5.1.2.4 - MQTT Broker
The MQTT broker in the United Manufacturing Hub is HiveMQ
and is customized to fit the needs of the stack. It’s a core component of
the stack and is used to communicate between the different microservices.
How it works
The MQTT broker is responsible for receiving MQTT messages from the
different microservices and forwarding them to the
MQTT Kafka bridge.
What’s next
Read the MQTT Broker reference documentation
to learn more about the technical details of the MQTT Broker microservice.
5.1.3 - Historian
Insight into the Historian’s role in storing and visualizing data within the
UMH ecosystem.
The Historian in the United Manufacturing Hub serves as a comprehensive data
management and visualization system. It includes:
kafka-to-postgresql-v2:
Archives Kafka messages adhering to the Data Model V2 schema into the database.
TimescaleDB:
An open-source SQL database specialized in time-series data storage.
Grafana:
A software tool for data visualization and analytics.
factoryinsight:
An analytics tool designed for data analysis, including calculating operational efficiency metrics like OEE.
Redis:
Utilized as an in-memory data structure store for caching purposes.
This structure ensures that data from the Unified Namespace is systematically
stored, processed, and made visually accessible, providing OT professionals with
real-time insights and analytics on shop floor operations.
graph LR
2["`fa:fa-user **OT Professional / Shopfloor**
Monitors and manages the shopfloor, including safety, automation and maintenance`"]
style 2 fill:#dddddd,stroke:#9a9a9a,color:#000000
51["`**Unified Namespace**
The central source of truth for all events and messages on the shop floor.`"]
style 51 fill:#aaaaaa,stroke:#47a0b5,color:#000000
subgraph 64 [Historian]
style 64 fill:#ffffff,stroke:#47a0b5,color:#47a0b5
65["`**kafka-to-postgresql-v2**
Stores in the database the Kafka messages that follow the Data Model V2 schema`"]
style 65 fill:#aaaaaa,stroke:#47a0b5,color:#000000
66["`**TimescaleDB**
An open-source time-series SQL database`"]
style 66 fill:#aaaaaa,stroke:#47a0b5,color:#000000
67["`**Grafana**
Visualization and analytics software`"]
style 67 fill:#aaaaaa,stroke:#47a0b5,color:#000000
68["`**factoryinsight**
Analytics software that allows data analysis, like OEE`"]
style 68 fill:#aaaaaa,stroke:#47a0b5,color:#000000
69["`**grafana-datasource-v2**
Grafana plugin to easily connect to factoryinsight`"]
style 69 fill:#aaaaaa,stroke:#47a0b5,color:#000000
70["`**Redis**
In-memory data structure store used for caching`"]
style 70 fill:#aaaaaa,stroke:#47a0b5,color:#000000
end
65-. Stores data .->66
51-. Stores data in a
predefined schema via .->65
67-. Performs SQL queries .->66
67-. Includes .->69
69-. Extracts KPIs and other
high-level metrics .->68
68-. Queries data .->66
68<-.->70
65<-.->70
2-. Visualize real-time
dashboards .->67
The cache in the United Manufacturing Hub is Redis, a
key-value store that is used as a cache for the other microservices.
How it works
Recently used data is stored in the cache to reduce the load on the database.
All the microservices that need to access the database will first check if the
data is available in the cache. If it is, it will be used, otherwise the
microservice will query the database and store the result in the cache.
By default, Redis is configured to run in standalone mode, which means that it
will only have one master node.
What’s next
Read the Cache reference documentation
to learn more about the technical details of the cache microservice.
5.1.3.2 - Database
The database microservice is the central component of the United Manufacturing
Hub and is based on TimescaleDB, an open-source relational database built for
handling time-series data. TimescaleDB is designed to provide scalable and
efficient storage, processing, and analysis of time-series data.
You can find more information on the datamodel of the database in the
Data Model section, and read
about the choice to use TimescaleDB in the
blog article.
How it works
When deployed, the database microservice will create two databases, with the
related usernames and passwords:
grafana: This database is used by Grafana to store the dashboards and
other data.
factoryinsight: This database is the main database of the United Manufacturing
Hub. It contains all the data that is collected by the microservices.
Read the Database reference documentation
to learn more about the technical details of the database microservice.
5.1.3.3 - Factoryinsight
Factoryinsight is a microservice that provides a set of REST APIs to access the
data from the database. It is particularly useful to calculate the Key
Performance Indicators (KPIs) of the factories.
How it works
Factoryinsight exposes REST APIs to access the data from the database or calculate
the KPIs. By default, it’s only accessible from the internal network of the
cluster, but it can be configured to be
accessible from the external network.
The APIs require authentication, that can be either a Basic Auth or a Bearer
token. Both of these can be found in the Secret factoryinsight-secret.
What’s next
Read the Factoryinsight reference documentation
to learn more about the technical details of the Factoryinsight microservice.
5.1.3.4 - Grafana
The grafana microservice is a web application that provides visualization and
analytics capabilities. Grafana allows you to query, visualize, alert on and
understand your metrics no matter where they are stored.
It has a rich ecosystem of plugins that allow you to extend its functionality
beyond the core features.
How it works
Grafana is a web application that can be accessed through a web browser. It
let’s you create dashboards that can be used to visualize data from the database.
Thanks to some custom datasource plugins,
Grafana can use the various APIs of the United Manufacturing Hub to query the
database and display useful information.
What’s next
Read the Grafana reference documentation
to learn more about the technical details of the grafana microservice.
5.1.3.5 - Kafka to Postgresql V2
The Kafka to PostgreSQL v2 microservice plays a crucial role in consuming and
translating Kafka messages for storage in a PostgreSQL database. It aligns with
the specifications outlined in the Data Model v2.
How it works
Utilizing Data Model v2, Kafka to PostgreSQL v2 is specifically configured to
process messages from topics beginning with umh.v1.. Each new topic undergoes
validation against Data Model v2 before message consumption begins. This ensures
adherence to the defined data structure and standards.
Message payloads are scrutinized for structural validity prior to database insertion.
Messages with invalid payloads are systematically rejected to maintain data integrity.
The microservice then evaluates the payload to determine the appropriate table
for insertion within the PostgreSQL database. The decision is based on the data
type of the payload field, adhering to the following rules:
Numeric data types are directed to the tag table.
String data types are directed to the tag_string table.
What’s next
Read the Kafka to Postgresql v2
reference documentation to learn more about the technical details of the
Kafka to Postgresql v2 microservice.
5.1.3.6 - Umh Datasource V2
The plugin, umh-datasource-v2, is a Grafana data source plugin that allows you to fetch
resources from a database and build queries for your dashboard.
How it works
When creating a new panel, select umh-datasource-v2 from the Data source drop-down menu. It will then fetch the resources
from the database. The loading time may depend on your internet speed.
Select the resources in the cascade menu to build your query. DefaultArea and DefaultProductionLine are placeholders
for the future implementation of the new data model.
Only the available values for the specified work cell will be fetched from the database. You can then select which data value you want to query.
Next you can specify how to transform the data, depending on what value you selected.
For example, all the custom tags will have the aggregation options available. For example if you query a processValue:
Time bucket: lets you group data in a time bucket
Aggregates: common statistical aggregations (maximum, minimum, sum or count)
Handling missing values: lets you choose how missing data should be handled
Configuration
In Grafana, navigate to the Data sources configuration panel.
Select umh-v2-datasource to configure it.
Configurations:
Base URL: the URL for the factoryinsight backend. Defaults to http://united-manufacturing-hub-factoryinsight-service/.
Enterprise name: previously customerID for the old datasource plugin. Defaults to factoryinsight.
API Key: authenticates the API calls to factoryinsight.
Can be found with UMHLens by going to Secrets → factoryinsight-secret → apiKey. It should follow the format Basic xxxxxxxx.
5.2 - Device & Container Infrastructure
Understand the automated deployment and setup process in UMH’s Device &
Container Infrastructure.
The Device & Container Infrastructure in the United Manufacturing Hub automates
the deployment and setup of the data infrastructure in various environments. It
is tailored for Edge deployments, particularly in Demilitarized Zones, to minimize
latency on-premise, and also extends into the Cloud to harness its functionalities.
It consists of several interconnected components:
Provisioning Server: Manages the initial bootstrapping of devices,
including iPXE configuration and ignition file distribution.
Flatcar Image Server: A central repository hosting various versions of
Flatcar Container Linux images, ensuring easy access and version control.
Customized iPXE: A specialized bootloader configured to streamline the
initial boot process by fetching UMH-specific settings and configurations.
First and Second Stage Flatcar OS: A two-stage operating system setup where
the first stage is a temporary OS used for installing the second stage, which
is the final operating system equipped with specific configurations and tools.
Installation Script: An automated script hosted at management.umh.app,
responsible for setting up and configuring the Kubernetes environment.
Kubernetes (k3s): A lightweight Kubernetes setup that forms the backbone
of the container orchestration system.
This infrastructure ensures a streamlined, automated installation process, laying
a robust foundation for the United Manufacturing Hub’s operation.
graph LR
16["`**Management Console**
Configures, manages, and monitors Data and Device & Container Infrastructures in the UMH Integrated Platform`"]
style 16 fill:#aaaaaa,stroke:#47a0b5,color:#000000
29["`**Provisioning Server**
Handles device bootstrapping, including iPXE configuration and ignition file distribution.`"]
style 29 fill:#aaaaaa,stroke:#47a0b5,color:#000000
30["`**Flatcar Image Server**
Hosts Flatcar Container Linux images, providing a central repository for version management.`"]
style 30 fill:#aaaaaa,stroke:#47a0b5,color:#000000
subgraph 27 [Device & Container Infrastructure]
style 27 fill:#ffffff,stroke:#47a0b5,color:#47a0b5
28["`**Installation Script**
This script automates the Kubernetes environment setup and configuration.`"]
style 28 fill:#aaaaaa,stroke:#47a0b5,color:#000000
31["`**Kubernetes**
Core of the container orchestration system, featuring a lightweight Kubernetes setup.`"]
style 31 fill:#aaaaaa,stroke:#47a0b5,color:#000000
32["`**Customized iPXE**
Configured bootloader for fetching UMH-specific settings, optimizing the initial boot process.`"]
style 32 fill:#aaaaaa,stroke:#47a0b5,color:#000000
33["`**First Stage Flatcar OS**
Transitional OS used during the installation of the permanent Flatcar OS.`"]
style 33 fill:#aaaaaa,stroke:#47a0b5,color:#000000
34["`**Second Stage Flatcar OS**
Final operating system, equipped with specific configurations and essential tools.`"]
style 34 fill:#aaaaaa,stroke:#47a0b5,color:#000000
end
32-. "Downloads specified
Flatcar version for
initial boot." .->30
33-. "Retrieves image for
second-stage Flatcar OS." .->30
34-. "Regularly checks for
OS updates." .->30
32-. "Initiates boot-up of
first-stage OS." .->33
32-. "Requests configuration and
retrieves iPXE config." .->29
33-. "Installs second-stage
Flatcar OS." .->34
33-. "Fetches ignition config with
installation script." .->29
34-. "Executes installation script." .->28
34-. "Acquires token-specific
ignition config." .->29
28-. "Installs Kubernetes (k3s) and
required tools, then deploys
the Data Infrastructure." .->31
28-. "Deploys Management
Companion into Kubernetes." .->16
Delve into the functionalities and components of the UMH’s Management Console,
ensuring efficient system management.
The Management Console is pivotal in configuring, managing, and monitoring the
United Manufacturing Hub. It comprises a web application,
a backend API and the management companion agent, all designed to ensure secure and
efficient operation.
Web Application
The client-side Web Application, available at management.umh.app
enables users to register, add, and manage instances, and monitor the
infrastructure within the United Manufacturing Hub. All communications between
the Web Application and the user’s devices are end-to-end encrypted, ensuring
complete confidentiality from the backend.
Management Companion
Deployed on each UMH instance, the Management Companion acts as an agent responsible
for decrypting messages coming from the user via the Backend and executing
requested actions. Responses are end-to-end encrypted as well, maintaining a
secure and opaque channel to the Backend.
Management Updater
The Updater is a custom Job run by the Management Companion, responsible for
updating the Management Companion itself. Its purpose is to automate the process
of upgrading the Management Companion to the latest version, reducing the
administrative overhead of managing UMH instances.
Backend
The Backend is the public API for the Management Console. It functions as a bridge
between the Web Application and the Management Companion. Its primary role is to
verify user permissions for accessing UMH instances. Importantly, the backend
does not have access to the contents of the messages exchanged between the Web
Application and the Management Companion, ensuring that communication remains
opaque and secure.
5.4 - Legacy
This section gives an overview of the legacy microservices that can be found
in older versions of the United Manufacturing Hub.
This section provides a comprehensive overview of the legacy microservices within
the United Manufacturing Hub. These microservices are currently in a transitional
phase, being maintained and deployed alongside newer versions of UMH as we gradually
shift from Data Model v1 to v2. While these legacy components are set to be deprecated
in the future, they continue to play a crucial role in ensuring smooth operations
and compatibility during this transition period.
5.4.1 - Factoryinput
This microservice is still in development and is not considered stable for production use
Factoryinput provides REST endpoints for MQTT messages via HTTP requests.
This microservice is typically accessed via grafana-proxy
How it works
The factoryinput microservice provides REST endpoints for MQTT messages via HTTP requests.
The main endpoint is /api/v1/{customer}/{location}/{asset}/{value}, with a POST
request method. The customer, location, asset and value are all strings. And are
used to build the MQTT topic. The body of the HTTP request is used as the MQTT
payload.
What’s next
Read the Factoryinput reference
documentation to learn more about the technical details of the Factoryinput
microservice.
5.4.2 - Grafana Proxy
This microservice is still in development and is not considered stable for production use
How it works
The grafana-proxy microservice serves an HTTP REST endpoint located at
/api/v1/{service}/{data}. The service parameter specifies the backend
service to which the request should be proxied, like factoryinput or
factoryinsight. The data parameter specifies the API endpoint to forward to
the backend service. The body of the HTTP request is used as the payload for
the proxied request.
What’s next
Read the Grafana Proxy reference
documentation to learn more about the technical details of the Grafana Proxy
microservice.
5.4.3 - Kafka Bridge
Kafka-bridge is a microservice that connects two Kafka brokers and forwards
messages between them. It is used to connect the local broker of the edge computer
with the remote broker on the server.
How it works
This microservice has two ways of operation:
High Integrity: This mode is used for topics that are critical for the
user. It is garanteed that no messages are lost. This is achieved by
committing the message only after it has been successfully inserted into the
database. Ususally all the topics are forwarded in this mode, except for
processValue, processValueString and raw messages.
High Throughput: This mode is used for topics that are not critical for
the user. They are forwarded as fast as possible, but it is possible that
messages are lost, for example if the database struggles to keep up. Usually
only the processValue, processValueString and raw messages are forwarded in
this mode.
What’s next
Read the Kafka Bridge reference documentation
to learn more about the technical details of the Kafka Bridge microservice.
5.4.4 - Kafka State Detector
This microservice is still in development and is not considered stable for production use
How it works
What’s next
5.4.5 - Kafka to Postgresql
Kafka-to-postgresql is a microservice responsible for consuming kafka messages
and inserting the payload into a Postgresql database. Take a look at the
Datamodel to see how the data is structured.
This microservice requires that the Kafka Topic umh.v1.kafka.newTopic exits. This will happen automatically from version 0.9.12.
How it works
By default, kafka-to-postgresql sets up two Kafka consumers, one for the
High Integrity topics and one for the
High Throughput topics.
The graphic below shows the program flow of the microservice.
High integrity
The High integrity topics are forwarded to the database in a synchronous way.
This means that the microservice will wait for the database to respond with a
non error message before committing the message to the Kafka broker.
This way, the message is garanteed to be inserted into the database, even though
it might take a while.
Most of the topics are forwarded in this mode.
The picture below shows the program flow of the high integrity mode.
High throughput
The High throughput topics are forwarded to the database in an asynchronous way.
This means that the microservice will not wait for the database to respond with
a non error message before committing the message to the Kafka broker.
This way, the message is not garanteed to be inserted into the database, but
the microservice will try to insert the message into the database as soon as
possible. This mode is used for the topics that are expected to have a high
throughput.
Read the Kafka to Postgresql reference documentation
to learn more about the technical details of the Kafka to Postgresql microservice.
5.4.6 - MQTT Bridge
MQTT-bridge is a microservice that connects two MQTT brokers and forwards
messages between them. It is used to connect the local broker of the edge computer
with the remote broker on the server.
How it works
This microservice subscribes to topics on the local broker and publishes the
messages to the remote broker, while also subscribing to topics on the remote
broker and publishing the messages to the local broker.
What’s next
Read the MQTT Bridge reference documentation
to learn more about the technical details of the MQTT Bridge microservice.
5.4.7 - MQTT Kafka Bridge
Mqtt-kafka-bridge is a microservice that acts as a bridge between MQTT brokers
and Kafka brokers, transfering messages from one to the other and vice versa.
This microservice requires that the Kafka Topic umh.v1.kafka.newTopic exits.
This will happen automatically from version 0.9.12.
Since version 0.9.10, it allows all raw messages, even if their content is not
in a valid JSON format.
How it works
Mqtt-kafka-bridge consumes topics from a message broker, translates them to
the proper format and publishes them to the other message broker.
What’s next
Read the MQTT Kafka Bridge
reference documentation to learn more about the technical details of the
MQTT Kafka Bridge microservice.
5.4.8 - MQTT Simulator
This microservice is a community contribution and is not part of the main stack of the United Manufacturing Hub, but is enabled by default.
The IoTSensors MQTT Simulator is a microservice that simulates sensors sending data to the
MQTT broker. You can read the full documentation on the
The microservice publishes messages on the topic ia/raw/development/ioTSensors/,
creating a subtopic for each simulation. The subtopics are the names of the
simulations, which are Temperature, Humidity, and Pressure.
The values are calculated using a normal distribution with a mean and standard
deviation that can be configured.
What’s next
Read the IoTSensors MQTT Simulator reference
documentation to learn more about the technical details of the IoTSensors MQTT Simulator
microservice.
This microservice is deprecated and should not be used anymore in production.
Please use kafka-to-postgresql instead.
How it works
The mqtt-to-postgresql microservice subscribes to the MQTT broker and saves
the values of the messages on the topic ia/# in the database.
What’s next
Read the MQTT to Postgresql reference
documentation to learn more about the technical details of the MQTT to Postgresql
microservice.
5.4.10 - OPCUA Simulator
This microservice is a community contribution and is not part of the main stack of the United Manufacturing Hub, but is enabled by default.
How it works
The OPCUA Simulator is a microservice that simulates OPCUA devices. You can read
the full documentation on the
GitHub repository.
You can then connect to the simulated OPCUA server via Node-RED and read the
values of the simulated devices. Learn more about how to connect to the OPCUA
simulator to Node-RED in our guide.
What’s next
Read the OPCUA Simulator reference
documentation to learn more about the technical details of the OPCUA Simulator
microservice.
5.4.11 - PackML Simulator
This microservice is a community contribution and is not part of the main stack of the United Manufacturing Hub, but it is enabled by default.
PackML MQTT Simulator is a virtual line that interfaces using PackML implemented
over MQTT. It implements the following PackML State model and communicates
over MQTT topics as defined by environmental variables. The simulator can run
with either a basic MQTT topic structure or SparkPlugB.
Read the PackML Simulator reference
documentation to learn more about the technical details of the PackML Simulator
microservice.
5.4.12 - Tulip Connector
This microservice is still in development and is not considered stable for production use.
The tulip-connector microservice enables communication with the United
Manufacturing Hub by exposing internal APIs, like
factoryinsight, to the
internet. With this REST endpoint, users can access data stored in the UMH and
seamlessly integrate Tulip with a Unified Namespace and on-premise Historian.
Furthermore, the tulip-connector can be customized to meet specific customer
requirements, including integration with an on-premise MES system.
How it works
The tulip-connector acts as a proxy between the internet and the UMH. It
exposes an endpoint to forward requests to the UMH and returns the response.
What’s next
Read the Tulip Connector reference
documentation to learn more about the technical details of the Tulip Connector
microservice.
5.4.13 - Grafana Plugins
This section contains the overview of the custom Grafana plugins that can be
used to access the United Manufacturing Hub.
5.4.13.1 - Umh Datasource
This page contains the technical documentation of the plugin umh-datasource, which allows for easy data extraction from factoryinsight.
We are no longer maintaining this microservice. Use instead our new microservice datasource-v2 for data extraction from factoryinsight.
The umh datasource is a Grafana 8.X compatible plugin, that allows you to fetch resources from a database
and build queries for your dashboard.
How it works
When creating a new panel, select umh-datasource from the Data source drop-down menu. It will then fetch the resources
from the database. The loading time may depend on your internet speed.
Select your query parameters Location, Asset and Value to build your query.
Configuration
In Grafana, navigate to the Data sources configuration panel.
Select umh-datasource to configure it.
Configurations:
Base URL: the URL for the factoryinsight backend. Defaults to http://united-manufacturing-hub-factoryinsight-service/.
Enterprise name: previously customerID for the old datasource plugin. Defaults to factoryinsight.
API Key: authenticates the API calls to factoryinsight.
Can be found with UMHLens by going to Secrets → factoryinsight-secret → apiKey. It should follow the format Basic xxxxxxxx.
5.4.13.2 - Factoryinput Panel
This page contains the technical documentation of the plugin factoryinput-panel, which allows for easy execution of MQTT messages inside the UMH stack from a Grafana panel.
This plugin is still in development and is not considered stable for production use
Below you will find a schematic of this flow, through our stack.
6 - Legacy
During the last major restructuring of the UMH documentation, many existing pages were removed. Most of the removed pages can be found in this legacy folder.
Please note that the information in this folder is out of date, partly obsolete
and no longer maintained.
6.1 - Data Model (v1)
This page describes the data model of the UMH stack - from the message payloads up to database tables.
The Data Infrastructure of the UMH consists out of the three components: Connectivity, Unified Namespace, and Historian (see also Architecture). Each of the components has their own standards and best-practices, so a consistent data model across
multiple building blocks need to combine all of them.
If you like to learn more about our data model & ADR’s checkout our learn article.
Connectivity
Incoming data is often unstructured, therefore our standard allows either conformant data in our _historian schema, or any kind of data in any other schema.
Our key considerations where:
Event driven architecture: We only look at changes, reducing network and system load
Ease of use: We allow any data in, allowing OT & IT to process it as they wish
The UNS employs MQTT and Kafka in a hybrid approach, utilizing MQTT for efficient data collection and Kafka for robust data processing.
The UNS is designed to be reliable, scalable, and maintainable, facilitating real-time data processing and seamless integration or removal of system components.
These elements are the foundation for our data model in UNS:
Incoming data based on OT standards: Data needs to be contextualized here not by IT people, but by OT people.
They want to model their data (topic hierarchy and payloads) according to ISA-95, Weihenstephaner Standard, Omron PackML, Euromap84, (or similar) standards, and need e.g., JSON as payload to better understand it.
Hybrid Architecture: Combining MQTT’s user-friendliness and widespread adoption in Operational Technology (OT) with Kafka’s advanced processing capabilities.
Topics and payloads can not be interchanged fully between them due to limitations in MQTT and Kafka, so some trade-offs needs to be done.
Processed data based on IT standards: Data is sent after processing to IT systems, and needs to adhere with standards: the data inside of the UNS needs to be easy processable for either contextualization, or storing it in a Historian or Data Lake.
IT best-practice: used SQL and Postgres for easy compatibility, and therefore TimescaleDb
Straightforward queries: we aim to make easy SQL queries, so that everyone can build dashboards
Performance: because of time-series and typical workload, the database layout might not be optimized fully on usability, but we did some trade-offs that allow it to store millions of data points per second
6.1.1 - Unified Namespace
Describes all available _schema and their structure
Topic structure
flowchart LR
umh --> v1
v1 --> enterprise
enterprise -->|Optional| site
site -->|Optional| area
area -->|Optional| productionLine
productionLine -->|Optional| workCell
workCell -->|Optional| originID
originID -->|Optional| _schema["_schema (Ex: _historian, _analytics, _local)"]
_schema -->_opt["Schema dependent context"]
classDef mqtt fill:#00dd00,stroke:#333,stroke-width:4px;
class umh,v1,enterprise,_schema mqtt;
classDef optional fill:#77aa77,stroke:#333,stroke-width:4px;
class site,area,productionLine,workCell,originID optional;
enterprise -.-> _schema
site -.-> _schema
area -.-> _schema
productionLine -.-> _schema
workCell -.-> _schema
click _schema href "#_schema"
click umh href "#versioning-prefix"
click v1 href "#versioning-prefix"
The umh/v1 at the beginning is obligatory. It ensures that the structure can evolve over time without causing confusion or compatibility issues.
Topic Names & Rules
All part of this structure, except for enterprise and _schema are optional.
They can consist of any letters (a-z, A-Z), numbers (0-9) and therein symbols (- & _).
Be careful to avoid ., +, # or / as these are special symbols in Kafka or MQTT.
Ensure that your topic always begins with umh/v1, otherwise our system will ignore your messages.
Be aware that our topics are case-sensitive, therefore umh.v1.ACMEIncorperated is not the same as umh.v1.acmeincorperated.
Throughout this documentation we will use the MQTT syntax for topics (umh/v1), the corresponding Kafka topic names are the same but / replaced with .
Topic validator
OriginID
This part identifies where the data is coming from.
Good options include the senders MAC address, hostname, container id.
Examples for originID: 00-80-41-ae-fd-7e, E588974, e5f484a1791d
Messages tagged with _analytics will be processed by our analytics pipeline.
They are used for automatic calculation of KPI’s and other statistics.
_local
This key might contain any data, that you do not want to bridge to other nodes (it will however be MQTT-Kafka bridged on its node).
For example this could be data you want to pre-process on your local node, and then put into another _schema.
This data must not necessarily be JSON.
Other
Any other schema, which starts with an underscore (for example: _images), will be forwarded by both MQTT-Kafka & Kafka-Kafka bridges but never processed or stored.
This data must not necessarily be JSON.
Converting other data models
Most data models already follow a location based naming structure.
KKS Identification System for Power Stations
KKS (Kraftwerk-Kennzeichensystem) is a standardized system for identifying and classifying equipment and systems in power plants, particularly in German-speaking countries.
In a flow diagram, the designation is: 1 2LAC03 CT002 QT12
Level 0 Classification:
Block 1 of a power plant site is designated as 1 in this level.
Level 1 Classification:
The designation for the 3rd feedwater pump in the 2nd steam-water circuit is 2LAC03. This means:
Main group 2L: 2nd steam, water, gas circuit
Subgroup (2L)A: Feedwater system
Subgroup (2LA)C: Feedwater pump system
Counter (2LAC)03: third feedwater pump system
Level 2 Classification:
For the 2nd temperature measurement, the designation CT002 is used. This means:
Main group C: Direct measurement
Subgroup (C)T: Temperature measurement
Counter (CT)002: second temperature measurement
Level 3 Classification:
For the 12th immersion sleeve as a sensor protection, the designation QT12 is used. This means:
Main group Q: Control technology equipment
Subgroup (Q)T: Protective tubes and immersion sleeves as sensor protection
Counter (QT)12: twelfth protective tube or immersion sleeve
The above example refers to the 12th immersion sleeve at the 2nd temperature measurement of the 3rd feed pump in block 1 of a power plant site.
Translating this in our data model could result in:
umh/v1/nuclearCo/1/2LAC03/CT002/QT12/_schema
Where:
nuclearCo: Represents the enterprise or the name of the nuclear company.
1: Maps to the site, corresponding to Block 1 of the power plant as per the KKS number.
2LAC03: Fits into the area, representing the 3rd feedwater pump in the 2nd steam-water circuit.
CT002: Aligns with productionLine, indicating the 2nd temperature measurement in this context.
QT12: Serves as the workCell or originID, denoting the 12th immersion sleeve.
_schema: Placeholder for the specific data schema being applied.
6.1.1.1 - _analytics
Messages for our analytics feature
Topic structure
flowchart LR
topicStart["umh.v1..."] --> _analytics
_analytics --> wo[work-order]
wo --> wo-create[create]
wo --> wo-start[start]
wo --> wo-stop[stop]
_analytics --> pt[product-type]
pt --> pt-create[create]
_analytics --> p[product]
p --> p-add[add]
p --> p-set-bad-quantity[setBadQuantity]
_analytics --> s[shift]
s --> s-add[add]
s --> s-delete[delete]
_analytics --> st[state]
st --> st-add[add]
st --> st-overwrite[overwrite]
classDef mqtt fill:#00dd00,stroke:#333,stroke-width:4px;
class umh,v1,enterprise,_analytics mqtt;
classDef type fill:#00ffbb,stroke:#333,stroke-width:4px;
class wo,pt,p,s,st type;
classDef func fill:#8899dd,stroke:#333,stroke-width:4px;
class wo-create,wo-start,wo-stop,pt-create,p-add,p-set-bad-quantity,s-add,s-delete,st-add,st-overwrite func;
click topicStart href "../"
click wo href "#work-order"
click pt href "#product-type"
click p href "#product"
click s href "#shift"
click wo-create href "#create"
click wo-start href "#start"
click wo-stop href "#stop"
click pt-create href "#create-1"
click p-add href "#add"
click p-set-bad-quantity href "#set-bad-quantity"
click s-add href "#add-1"
click s-delete href "#delete"
click st-add href "#add-2"
click st-overwrite href "#overwrite"
Our _historian messages are JSON containing a unix timestamp as milliseconds (timestamp_ms) and one or more key value pairs.
Each key value pair will be inserted at the given timestamp into the database.
If you use a boolean value, it will be interpreted as a number.
Tag grouping
Sometimes it makes sense to further group data together.
In the following example we have a CNC cutter, emitting data about it’s head position.
If we want to group this for easier access in Grafana, we could use two types of grouping.
Using Tags / Tag Groups in the Topic:
This will result in 3 new database entries, grouped by head & pos.
This can be useful, if we also want to monitor the cutter head temperature and other attributes, while still preserving most of the readability of the above method.
This function is an optimized version of get_asset_id that is defined as immutable.
It is the fastest of the three functions and should be used for all queries, except when you plan to manually modify values inside the asset table.
This function returns the id of the given asset.
It takes a variable number of arguments, where only the first (enterprise) is mandatory.
This function is only kept for compatibility reasons and should not be used in new queries, see get_asset_id_stable or get_asset_id_immutable instead.
There is no immutable version of get_asset_ids, as the returned values will probably change over time.
[Legacy] get_asset_ids
This function returns the ids of the given assets.
It takes a variable number of arguments, where only the first (enterprise) is mandatory.
It is only kept for compatibility reasons and should not be used in new queries, see get_asset_ids_stable instead.
This table holds all assets.
An asset for us is the unique combination of enterprise, site, area, line, workcell & origin_id.
All keys except for id and enterprise are optional.
In our example we have just started our CNC cutter, so it’s unique asset will get inserted into the database.
It already contains some data we inserted before so the new asset will be inserted at id: 8
id
enterprise
site
area
line
workcell
origin_id
1
acme-corporation
2
acme-corporation
new-york
3
acme-corporation
london
north
assembly
4
stark-industries
berlin
south
fabrication
cell-a1
3002
5
stark-industries
tokyo
east
testing
cell-b3
3005
6
stark-industries
paris
west
packaging
cell-c2
3009
7
umh
cologne
office
dev
server1
sensor0
8
cuttingincoperated
cologne
cnc-cutter
work_order
This table holds all work orders.
A work order is a unique combination of external_work_order_id and asset_id.
work_order_id
external_work_order_id
asset_id
product_type_id
quantity
status
start_time
end_time
1
#2475
8
1
100
0
2022-01-01T08:00:00Z
2022-01-01T18:00:00Z
product_type
This table holds all product types.
A product type is a unique combination of external_product_type_id and asset_id.
product_type_id
external_product_type_id
cycle_time_ms
asset_id
1
desk-leg-0112
10.0
8
product
This table holds all products.
product_type_id
product_batch_id
asset_id
start_time
end_time
quantity
bad_quantity
1
batch-n113
8
2022-01-01T08:00:00Z
2022-01-01T08:10:00Z
100
7
shift
This table holds all shifts.
A shift is a unique combination of asset_id and start_time.
shiftId
asset_id
start_time
end_time
1
8
2022-01-01T08:00:00Z
2022-01-01T19:00:00Z
state
This table holds all states.
A state is a unique combination of asset_id and start_time.
asset_id
start_time
state
8
2022-01-01T08:00:00Z
20000
8
2022-01-01T08:10:00Z
10000
6.1.2.2 - Historian
How _historian data is stored and can be queried
Our database for the umh.v1 _historian datamodel currently consists of three tables.
These are used for the _historian schema.
We choose this layout to enable easy lookups based on the asset features, while maintaining separation between data and names.
The split into tag & tag_string prevents accidental lookups of the wrong datatype, which might break queries such as aggregations, averages, …
erDiagram
asset {
int id PK "SERIAL PRIMARY KEY"
text enterprise "NOT NULL"
text site "DEFAULT '' NOT NULL"
text area "DEFAULT '' NOT NULL"
text line "DEFAULT '' NOT NULL"
text workcell "DEFAULT '' NOT NULL"
text origin_id "DEFAULT '' NOT NULL"
}
tag {
timestamptz timestamp "NOT NULL"
text name "NOT NULL"
text origin "NOT NULL"
int asset_id FK "REFERENCES asset(id) NOT NULL"
real value
}
tag_string {
timestamptz timestamp "NOT NULL"
text name "NOT NULL"
text origin "NOT NULL"
int asset_id FK "REFERENCES asset(id) NOT NULL"
text value
}
asset ||--o{ tag : "id"
asset ||--o{ tag_string : "id"
This table holds all assets.
An asset for us is the unique combination of enterprise, site, area, line, workcell & origin_id.
All keys except for id and enterprise are optional.
In our example we have just started our CNC cutter, so it’s unique asset will get inserted into the database.
It already contains some data we inserted before so the new asset will be inserted at id: 8
id
enterprise
site
area
line
workcell
origin_id
1
acme-corporation
2
acme-corporation
new-york
3
acme-corporation
london
north
assembly
4
stark-industries
berlin
south
fabrication
cell-a1
3002
5
stark-industries
tokyo
east
testing
cell-b3
3005
6
stark-industries
paris
west
packaging
cell-c2
3009
7
umh
cologne
office
dev
server1
sensor0
8
cuttingincoperated
cologne
cnc-cutter
tag
This table is a timescale hypertable.
These tables are optimized to contain a large amount of data which is roughly sorted by time.
In our example we send data to umh/v1/cuttingincorperated/cologne/cnc-cutter/_historian/head using the following JSON:
The origin is a placeholder for a later feature, and currently defaults to unknown.
tag_string
This table is the same as tag, but for string data.
Our CNC cutter also emits the G-Code currently processed.
umh/v1/cuttingincorperated/cologne/cnc-cutter/_historian
Unknown (30000-59999): These states represent that the asset is in an unspecified state.
Glossary
OEE: Overall Equipment Effectiveness
KPI: Key Performance Indicator
Conclusion
This documentation provides a comprehensive overview of the states used in the United Manufacturing Hub software stack and their respective categories. For more information on each state category and its individual states, please refer to the corresponding subpages.
6.1.3.1 - Active (10000-29999)
These states represent that the asset is actively producing
10000: ProducingAtFullSpeedState
This asset is running at full speed.
Examples for ProducingAtFullSpeedState
WS_Cur_State: Operating
PackML/Tobacco: Execute
20000: ProducingAtLowerThanFullSpeedState
Asset is producing, but not at full speed.
Examples for ProducingAtLowerThanFullSpeedState
WS_Cur_Prog: StartUp
WS_Cur_Prog: RunDown
WS_Cur_State: Stopping
PackML/Tobacco : Stopping
WS_Cur_State: Aborting
PackML/Tobacco: Aborting
WS_Cur_State: Holding
Ws_Cur_State: Unholding
PackML:Tobacco: Unholding
WS_Cur_State Suspending
PackML/Tobacco: Suspending
WS_Cur_State: Unsuspending
PackML/Tobacco: Unsuspending
PackML/Tobacco: Completing
WS_Cur_Prog: Production
EUROMAP: MANUAL_RUN
EUROMAP: CONTROLLED_RUN
Currently not included:
WS_Prog_Step: all
6.1.3.2 - Unknown (30000-59999)
These states represent that the asset is in an unspecified state
30000: UnknownState
Data for that particular asset is not available (e.g. connection to the PLC is disrupted)
Examples for UnknownState
WS_Cur_Prog: Undefined
EUROMAP: Offline
40000 UnspecifiedStopState
The asset is not producing, but the reason is unknown at the time.
Examples for UnspecifiedStopState
WS_Cur_State: Clearing
PackML/Tobacco: Clearing
WS_Cur_State: Emergency Stop
WS_Cur_State: Resetting
PackML/Tobacco: Clearing
WS_Cur_State: Held
EUROMAP: Idle
Tobacco: Other
WS_Cur_State: Stopped
PackML/Tobacco: Stopped
WS_Cur_State: Starting
PackML/Tobacco: Starting
WS_Cur_State: Prepared
WS_Cur_State: Idle
PackML/Tobacco: Idle
PackML/Tobacco: Complete
EUROMAP: READY_TO_RUN
50000: MicrostopState
The asset is not producing for a short period (typically around five minutes), but the reason is unknown at the time.
6.1.3.3 - Material (60000-99999)
These states represent that the asset has issues regarding materials.
60000 InletJamState
This machine does not perform its intended function due to a lack of material flow in the infeed of the machine, detected by the sensor system of the control system (machine stop). In the case of machines that have several inlets, the condition o lack in the inlet refers to the main flow , i.e. to the material (crate, bottle) that is fed in the direction of the filling machine (Central machine). The defect in the infeed is an extraneous defect, but because of its importance for visualization and technical reporting, it is recorded separately.
Examples for InletJamState
WS_Cur_State: Lack
70000: OutletJamState
The machine does not perform its intended function as a result of a jam in the good flow discharge of the machine, detected by the sensor system of the control system (machine stop). In the case of machines that have several discharges, the jam in the discharge condition refers to the main flow, i.e. to the good (crate, bottle) that is fed in the direction of the filling machine (central machine) or is fed away from the filling machine. The jam in the outfeed is an external fault 1v, but it is recorded separately, because of its importance for visualization and technical reporting.
Examples for OutletJamState
WS_Cur_State: Tailback
80000: CongestionBypassState
The machine does not perform its intended function due to a shortage in the bypass supply or a jam in the bypass discharge of the machine, detected by the sensor system of the control system (machine stop). This condition can only occur in machines with two outlets or inlets and in which the bypass is in turn the inlet or outlet of an upstream or downstream machine of the filling line (packaging and palleting machines). The jam/shortage in the auxiliary flow is an external fault, but it is recoded separately due to its importance for visualization and technical reporting.
Examples for the CongestionBypassState
WS_Cur_State: Lack/Tailback Branch Line
90000: MaterialIssueOtherState
The asset has a material issue, but it is not further specified.
Examples for MaterialIssueOtherState
WS_Mat_Ready (Information of which material is lacking)
PackML/Tobacco: Suspended
6.1.3.4 - Process(100000-139999)
These states represent that the asset is in a stop, which belongs to the process and cannot be avoided.
100000: ChangeoverState
The asset is in a changeover process between products.
Examples for ChangeoverState
WS_Cur_Prog: Program-Changeover
Tobacco: CHANGE OVER
110000: CleaningState
The asset is currently in a cleaning process.
Examples for CleaningState
WS_Cur_Prog: Program-Cleaning
Tobacco: CLEAN
120000: EmptyingState
The asset is currently emptied, e.g. to prevent mold for food products over the long breaks, e.g. the weekend.
Examples for EmptyingState
Tobacco: EMPTY OUT
130000: SettingUpState
This machine is currently preparing itself for production, e.g. heating up.
Examples for SettingUpState
EUROMAP: PREPARING
6.1.3.5 - Operator (140000-159999)
These states represent that the asset is stopped because of operator related issues.
140000: OperatorNotAtMachineState
The operator is not at the machine.
150000: OperatorBreakState
The operator is taking a break.
This is different from a planned shift as it could contribute to performance losses.
Examples for OperatorBreakState
WS_Cur_Prog: Program-Break
6.1.3.6 - Planning (160000-179999)
These states represent that the asset is stopped as it is planned to stopped (planned idle time).
160000: NoShiftState
There is no shift planned at that asset.
170000: NO OrderState
There is no order planned at that asset.
6.1.3.7 - Technical (180000-229999)
These states represent that the asset has a technical issue.
180000: EquipmentFailureState
The asset itself is defect, e.g. a broken engine.
Examples for EquipmentFailureState
WS_Cur_State: Equipment Failure
190000: ExternalFailureState
There is an external failure, e.g. missing compressed air.
Examples for ExternalFailureState
WS_Cur_State: External Failure
200000: ExternalInterferenceState
There is an external interference, e.g. the crane to move the material is currently unavailable.
210000: PreventiveMaintenanceStop
A planned maintenance action.
Examples for PreventiveMaintenanceStop
WS_Cur_Prog: Program-Maintenance
PackML: Maintenance
EUROMAP: MAINTENANCE
Tobacco: MAINTENANCE
220000: TechnicalOtherStop
The asset has a technical issue, but it is not specified further.
Examples for TechnicalOtherStop
WS_Not_Of_Fail_Code
PackML: Held
EUROMAP: MALFUNCTION
Tobacco: MANUAL
Tobacco: SET UP
Tobacco: REMOTE SERVICE
6.2 - Data Model (v0)
This page describes the data model of the UMH stack - from the message payloads up to database tables.
Raw Data
If you have events that you just want to send to the message broker / Unified Namespace without the need for it to be stored, simply send it to the raw topic.
This data will not be processed by the UMH stack, but you can use it to build your own data processing pipeline.
ProcessValue Data
If you have data that does not fit in the other topics (such as your PLC tags or sensor data), you can use the processValue topic. It will be saved in the database in the processValue or processValueString and can be queried using factorysinsight or the umh-datasource Grafana plugin.
Production Data
In a production environment, you should first declare products using addProduct.
This allows you to create an order using addOrder. Once you have created an order,
send an state message to tell the database that the machine is working (or not working) on the order.
When the machine is ordered to produce a product, send a startOrder message.
When the machine has finished producing the product, send an endOrder message.
Send count messages if the machine has produced a product, but it does not make sense to give the product its ID. Especially useful for bottling or any other use case with a large amount of products, where not each product is traced.
Recommendation: Start with addShift and state and continue from there on
Modifying Data
If you have accidentally sent the wrong state or if you want to modify a value, you can use the modifyState message.
Unique Product Tracking
You can use uniqueProduct to tell the database that a new instance of a product has been created.
If the produced product is scrapped, you can use scrapUniqueProduct to change its state to scrapped.
6.2.1 - Messages
For each message topic you will find a short description what the message is used for and which structure it has, as well as what structure the payload is excepted to have.
Introduction
The United Manufacturing Hub provides a specific structure for messages/topics, each with its own unique purpose.
By adhering to this structure, the UMH will automatically calculate KPIs for you, while also making it easier to maintain
consistency in your topic structure.
6.2.1.1 - activity
activity messages are sent when a new order is added.
This is part of our recommended workflow to create machine states. The data sent here will not be stored in the database automatically, as it will be required to be converted into a state. In the future, there will be a microservice, which converts these automatically.
A message is sent here each time a new order is added.
Content
key
data type
description
product_id
string
current product name
order_id
string
current order name
target_units
int64
amount of units to be produced
The product needs to be added before adding the order. Otherwise, this message will be discarded
One order is always specific to that asset and can, by definition, not be used across machines. For this case one would need to create one order and product for each asset (reason: one product might go through multiple machines, but might have different target durations or even target units, e.g. one big 100m batch get split up into multiple pieces)
JSON
Examples
One order was started for 100 units of product “test”:
This message can be emitted to add a child product to a parent product.
It can be sent multiple times, if a parent product is split up into multiple child’s or multiple parents are combined into one child. One example for this if multiple parts are assembled to a single product.
detectedAnomaly messages are sent when an asset has stopped and the reason is identified.
This is part of our recommended workflow to create machine states. The data sent here will not be stored in the database automatically, as it will be required to be converted into a state. In the future, there will be a microservice, which converts these automatically.
If you have a lot of processValues, we’d recommend not using the /processValue as topic, but to append the tag name as well, e.g., /processValue/energyConsumption. This will structure it better for usage in MQTT Explorer or for data processing only certain processValues.
For automatic data storage in kafka-to-postgresql both will work fine as long as the payload is correct.
Please be aware that the values may only be int or float, other character are not valid, so make sure there is no quotation marks or anything
sneaking in there. Also be cautious of using the JavaScript ToFixed() function, as it is converting a float into a string.
Usage
A message is sent each time a process value has been prepared. The key has a unique name.
Content
key
data type
description
timestamp_ms
int64
unix timestamp of message creation
<valuename>
int64 or float64
Represents a process value, e.g. temperature
Pre 0.10.0:
As <valuename> is either of type ´int64´ or ´float64´, you cannot use booleans. Convert to integers as needed; e.g., true = “1”, false = “0”
A message is sent each time a process value has been prepared. The key has a unique name. This message is used when the datatype of the process value is a string instead of a number.
Content
key
data type
description
timestamp_ms
int64
unix timestamp of message creation
<valuename>
string
Represents a process value, e.g. temperature
JSON
Example
At the shown timestamp the custom process value “customer” had a readout of “miller”.
recommendation are action recommendations, which require concrete and rapid action in order to quickly eliminate efficiency losses on the store floor.
Content
key
data type
description
uid
string
UniqueID of the product
timestamp_ms
int64
unix timestamp of message creation
customer
string
the customer ID in the data structure
location
string
the location in the data structure
asset
string
the asset ID in the data structure
recommendationType
int32
Name of the product
enabled
bool
-
recommendationValues
map
Map of values based on which this recommendation is created
diagnoseTextDE
string
Diagnosis of the recommendation in german
diagnoseTextEN
string
Diagnosis of the recommendation in english
recommendationTextDE
string
Recommendation in german
recommendationTextEN
string
Recommendation in english
JSON
Example
A recommendation for the demonstrator at the shown location has not been running for a while, so a recommendation is sent to either start the machine or specify a reason why it is not running.
{
    "UID": "43298756",
    "timestamp_ms": 15888796894,
    "customer": "united-manufacturing-hub",
    "location": "dccaachen",
    "asset": "DCCAachen-Demonstrator",
    "recommendationType": "1",
    "enabled": true,
    "recommendationValues": { "Treshold": 30, "StoppedForTime": 612685 },
    "diagnoseTextDE": "Maschine DCCAachen-Demonstrator steht seit 612685 Sekunden still (Status: 8, Schwellwert: 30)" ,
    "diagnoseTextEN": "Machine DCCAachen-Demonstrator is not running since 612685 seconds (status: 8, threshold: 30)",
    "recommendationTextDE":"Maschine DCCAachen-Demonstrator einschalten oder Stoppgrund auswählen.",
    "recommendationTextEN": "Start machine DCCAachen-Demonstrator or specify stop reason.",
}
Here a message is sent every time products should be marked as scrap. It works as follows: A message with scrap and timestamp_ms is sent. It starts with the count that is directly before timestamp_ms. It is now iterated step by step back in time and step by step the existing counts are set to scrap until a total of scrap products have been scraped.
Content
timestamp_ms is the unix timestamp, you want to go back from
scrap number of item to be considered as scrap.
You can specify maximum of 24h to be scrapped to avoid accidents
(NOT IMPLEMENTED YET) If counts does not equal scrap, e.g. the count is 5 but only 2 more need to be scrapped, it will scrap exactly 2. Currently, it would ignore these 2. see also #125
(NOT IMPLEMENTED YET) If no counts are available for this asset, but uniqueProducts are available, they can also be marked as scrap.
JSON
Examples
Ten items where scrapped:
{
"timestamp_ms":1589788888888,
"scrap":10}
Schema
{
    "$schema": "http://json-schema.org/draft/2019-09/schema",
    "$id": "https://learn.umh.app/content/docs/architecture/datamodel/messages/scrapCount.json",
    "type": "object",
    "default": {},
    "title": "Root Schema",
    "required": [
        "timestamp_ms",
        "scrap"
    ],
    "properties": {
        "timestamp_ms": {
            "type": "integer",
            "default": 0,
            "minimum": 0,
            "title": "The unix timestamp you want to go back from",
            "examples": [
              1589788888888
            ]
        },
        "scrap": {
            "type": "integer",
            "default": 0,
            "minimum": 0,
            "title": "Number of items to be considered as scrap",
            "examples": [
                10
            ]
        }
    },
    "examples": [
        {
            "timestamp_ms": 1589788888888,
            "scrap": 10
        },
        {
            "timestamp_ms": 1589788888888,
            "scrap": 5
        }
    ]
}
A message is sent here each time the asset changes status. Subsequent changes are not possible. Different statuses can also be process steps, such as “setup”, “post-processing”, etc. You can find a list of all supported states here.
Content
key
data type
description
state
uint32
value of the state according to the link above
timestamp_ms
uint64
unix timestamp of message creation
JSON
Example
The asset has a state of 10000, which means it is actively producing.
A message is sent here each time a product has been produced or modified. A modification can take place, for example, due to a downstream quality control.
There are two cases of when to send a message under the uniqueProduct topic:
The exact product doesn’t already have a UID (-> This is the case, if it has not been produced at an asset incorporated in the digital shadow). Specify a space holder asset = “storage” in the MQTT message for the uniqueProduct topic.
The product was produced at the current asset (it is now different from before, e.g. after machining or after something was screwed in). The newly produced product is always the “child” of the process. Products it was made out of are called the “parents”.
Content
key
data type
description
begin_timestamp_ms
int64
unix timestamp of start time
end_timestamp_ms
int64
unix timestamp of completion time
product_id
string
product ID of the currently produced product
isScrap
bool
optional information whether the current product is of poor quality and will be sorted out. Is considered false if not specified.
uniqueProductAlternativeID
string
alternative ID of the product
JSON
Example
The processing of product “Beilinger 30x15” with the AID 216381 started and ended at the designated timestamps. It is of low quality and due to be scrapped.
The database stores the messages in different tables.
Introduction
We are using the database TimescaleDB, which is based on PostgreSQL and supports standard relational SQL database work,
while also supporting time-series databases.
This allows for usage of regular SQL queries, while also allowing to process and store time-series data.
Postgresql has proven itself reliable over the last 25 years, so we are happy to use it.
If you want to learn more about database paradigms, please refer to the knowledge article about that topic.
It also includes a concise video summarizing what you need to know about different paradigms.
Our database model is designed to represent a physical manufacturing process. It keeps track of the following data:
The state of the machine
The products that are produced
The orders for the products
The workers’ shifts
Arbitrary process values (sensor data)
The producible products
Recommendations for the production
Please note that our database does not use a retention policy. This means that your database can grow quite fast if you save a lot of process values. Take a look at our guide on enabling data compression and retention in TimescaleDB to customize the database to your needs.
A good method to check your db size would be to use the following commands inside postgres shell:
CREATETABLEIFNOTEXISTScountTable(timestampTIMESTAMPTZNOTNULL,asset_idSERIALREFERENCESassetTable(id),countINTEGERCHECK(count>0),UNIQUE(timestamp,asset_id));-- creating hypertable
SELECTcreate_hypertable('countTable','timestamp');-- creating an index to increase performance
CREATEINDEXONcountTable(asset_id,timestampDESC);
This table stores process values, for example toner level of a printer, flow rate of a pump, etc.
This table, has a closely related table for storing number values, processValueTable.
CREATETABLEIFNOTEXISTSprocessValueStringTable(timestampTIMESTAMPTZNOTNULL,asset_idSERIALREFERENCESassetTable(id),valueNameTEXTNOTNULL,valueTESTNULL,UNIQUE(timestamp,asset_id,valueName));-- creating hypertable
SELECTcreate_hypertable('processValueStringTable','timestamp');-- creating an index to increase performance
CREATEINDEXONprocessValueStringTable(asset_id,timestampDESC);-- creating an index to increase performance
CREATEINDEXONprocessValueStringTable(valuename);
6.2.2.6 - processValueTable
processValueTable contains process values.
Usage
This table stores process values, for example toner level of a printer, flow rate of a pump, etc.
This table, has a closely related table for storing string values, processValueStringTable.
CREATETABLEIFNOTEXISTSprocessValueTable(timestampTIMESTAMPTZNOTNULL,asset_idSERIALREFERENCESassetTable(id),valueNameTEXTNOTNULL,valueDOUBLEPRECISIONNULL,UNIQUE(timestamp,asset_id,valueName));-- creating hypertable
SELECTcreate_hypertable('processValueTable','timestamp');-- creating an index to increase performance
CREATEINDEXONprocessValueTable(asset_id,timestampDESC);-- creating an index to increase performance
CREATEINDEXONprocessValueTable(valuename);
CREATETABLEIFNOTEXISTSstateTable(timestampTIMESTAMPTZNOTNULL,asset_idSERIALREFERENCESassetTable(id),stateINTEGERCHECK(state>=0),UNIQUE(timestamp,asset_id));-- creating hypertable
SELECTcreate_hypertable('stateTable','timestamp');-- creating an index to increase performance
CREATEINDEXONstateTable(asset_id,timestampDESC);
6.2.2.11 - uniqueProductTable
uniqueProductTable contains unique products and their IDs.
CREATETABLEIFNOTEXISTSuniqueProductTable(uidTEXTNOTNULL,asset_idSERIALREFERENCESassetTable(id),begin_timestamp_msTIMESTAMPTZNOTNULL,end_timestamp_msTIMESTAMPTZNOTNULL,product_idTEXTNOTNULL,is_scrapBOOLEANNOTNULL,quality_classTEXTNOTNULL,station_idTEXTNOTNULL,UNIQUE(uid,asset_id,station_id),CHECK(begin_timestamp_ms<end_timestamp_ms));-- creating an index to increase performance
CREATEINDEXONuniqueProductTable(asset_id,uid,station_id);
6.2.3 - States
States are the core of the database model. They represent the state of the machine at a given point in time.
States Documentation Index
Introduction
This documentation outlines the various states used in the United Manufacturing Hub software stack to calculate OEE/KPI and other production metrics.
State Categories
Active (10000-29999): These states represent that the asset is actively producing.
Material (60000-99999): These states represent that the asset has issues regarding materials.
Operator (140000-159999): These states represent that the asset is stopped because of operator related issues.
Planning (160000-179999): These states represent that the asset is stopped as it is planned to stop (planned idle time).
Process (100000-139999): These states represent that the asset is in a stop, which belongs to the process and cannot be avoided.
Unknown (30000-59999): These states represent that the asset is in an unspecified state.
Glossary
OEE: Overall Equipment Effectiveness
KPI: Key Performance Indicator
Conclusion
This documentation provides a comprehensive overview of the states used in the United Manufacturing Hub software stack and their respective categories. For more information on each state category and its individual states, please refer to the corresponding subpages.
6.2.3.1 - Active (10000-29999)
These states represent that the asset is actively producing
10000: ProducingAtFullSpeedState
This asset is running at full speed.
Examples for ProducingAtFullSpeedState
WS_Cur_State: Operating
PackML/Tobacco: Execute
20000: ProducingAtLowerThanFullSpeedState
Asset is producing, but not at full speed.
Examples for ProducingAtLowerThanFullSpeedState
WS_Cur_Prog: StartUp
WS_Cur_Prog: RunDown
WS_Cur_State: Stopping
PackML/Tobacco : Stopping
WS_Cur_State: Aborting
PackML/Tobacco: Aborting
WS_Cur_State: Holding
Ws_Cur_State: Unholding
PackML:Tobacco: Unholding
WS_Cur_State Suspending
PackML/Tobacco: Suspending
WS_Cur_State: Unsuspending
PackML/Tobacco: Unsuspending
PackML/Tobacco: Completing
WS_Cur_Prog: Production
EUROMAP: MANUAL_RUN
EUROMAP: CONTROLLED_RUN
Currently not included:
WS_Prog_Step: all
6.2.3.2 - Unknown (30000-59999)
These states represent that the asset is in an unspecified state
30000: UnknownState
Data for that particular asset is not available (e.g. connection to the PLC is disrupted)
Examples for UnknownState
WS_Cur_Prog: Undefined
EUROMAP: Offline
40000 UnspecifiedStopState
The asset is not producing, but the reason is unknown at the time.
Examples for UnspecifiedStopState
WS_Cur_State: Clearing
PackML/Tobacco: Clearing
WS_Cur_State: Emergency Stop
WS_Cur_State: Resetting
PackML/Tobacco: Clearing
WS_Cur_State: Held
EUROMAP: Idle
Tobacco: Other
WS_Cur_State: Stopped
PackML/Tobacco: Stopped
WS_Cur_State: Starting
PackML/Tobacco: Starting
WS_Cur_State: Prepared
WS_Cur_State: Idle
PackML/Tobacco: Idle
PackML/Tobacco: Complete
EUROMAP: READY_TO_RUN
50000: MicrostopState
The asset is not producing for a short period (typically around five minutes), but the reason is unknown at the time.
6.2.3.3 - Material (60000-99999)
These states represent that the asset has issues regarding materials.
60000 InletJamState
This machine does not perform its intended function due to a lack of material flow in the infeed of the machine, detected by the sensor system of the control system (machine stop). In the case of machines that have several inlets, the condition o lack in the inlet refers to the main flow , i.e. to the material (crate, bottle) that is fed in the direction of the filling machine (Central machine). The defect in the infeed is an extraneous defect, but because of its importance for visualization and technical reporting, it is recorded separately.
Examples for InletJamState
WS_Cur_State: Lack
70000: OutletJamState
The machine does not perform its intended function as a result of a jam in the good flow discharge of the machine, detected by the sensor system of the control system (machine stop). In the case of machines that have several discharges, the jam in the discharge condition refers to the main flow, i.e. to the good (crate, bottle) that is fed in the direction of the filling machine (central machine) or is fed away from the filling machine. The jam in the outfeed is an external fault 1v, but it is recorded separately, because of its importance for visualization and technical reporting.
Examples for OutletJamState
WS_Cur_State: Tailback
80000: CongestionBypassState
The machine does not perform its intended function due to a shortage in the bypass supply or a jam in the bypass discharge of the machine, detected by the sensor system of the control system (machine stop). This condition can only occur in machines with two outlets or inlets and in which the bypass is in turn the inlet or outlet of an upstream or downstream machine of the filling line (packaging and palleting machines). The jam/shortage in the auxiliary flow is an external fault, but it is recoded separately due to its importance for visualization and technical reporting.
Examples for the CongestionBypassState
WS_Cur_State: Lack/Tailback Branch Line
90000: MaterialIssueOtherState
The asset has a material issue, but it is not further specified.
Examples for MaterialIssueOtherState
WS_Mat_Ready (Information of which material is lacking)
PackML/Tobacco: Suspended
6.2.3.4 - Process(100000-139999)
These states represent that the asset is in a stop, which belongs to the process and cannot be avoided.
100000: ChangeoverState
The asset is in a changeover process between products.
Examples for ChangeoverState
WS_Cur_Prog: Program-Changeover
Tobacco: CHANGE OVER
110000: CleaningState
The asset is currently in a cleaning process.
Examples for CleaningState
WS_Cur_Prog: Program-Cleaning
Tobacco: CLEAN
120000: EmptyingState
The asset is currently emptied, e.g. to prevent mold for food products over the long breaks, e.g. the weekend.
Examples for EmptyingState
Tobacco: EMPTY OUT
130000: SettingUpState
This machine is currently preparing itself for production, e.g. heating up.
Examples for SettingUpState
EUROMAP: PREPARING
6.2.3.5 - Operator (140000-159999)
These states represent that the asset is stopped because of operator related issues.
140000: OperatorNotAtMachineState
The operator is not at the machine.
150000: OperatorBreakState
The operator is taking a break.
This is different from a planned shift as it could contribute to performance losses.
Examples for OperatorBreakState
WS_Cur_Prog: Program-Break
6.2.3.6 - Planning (160000-179999)
These states represent that the asset is stopped as it is planned to stopped (planned idle time).
160000: NoShiftState
There is no shift planned at that asset.
170000: NO OrderState
There is no order planned at that asset.
6.2.3.7 - Technical (180000-229999)
These states represent that the asset has a technical issue.
180000: EquipmentFailureState
The asset itself is defect, e.g. a broken engine.
Examples for EquipmentFailureState
WS_Cur_State: Equipment Failure
190000: ExternalFailureState
There is an external failure, e.g. missing compressed air.
Examples for ExternalFailureState
WS_Cur_State: External Failure
200000: ExternalInterferenceState
There is an external interference, e.g. the crane to move the material is currently unavailable.
210000: PreventiveMaintenanceStop
A planned maintenance action.
Examples for PreventiveMaintenanceStop
WS_Cur_Prog: Program-Maintenance
PackML: Maintenance
EUROMAP: MAINTENANCE
Tobacco: MAINTENANCE
220000: TechnicalOtherStop
The asset has a technical issue, but it is not specified further.
Examples for TechnicalOtherStop
WS_Not_Of_Fail_Code
PackML: Held
EUROMAP: MALFUNCTION
Tobacco: MANUAL
Tobacco: SET UP
Tobacco: REMOTE SERVICE
7 - Production Guide
This section contains information about how to use the stack in a production
environment.
7.1 - Installation
This section contains guides on how to install the United Manufacturing Hub.
Learn how to install the United Manufacturing Hub using completely Free and Open
Source Software.
7.1.1 - Advanced Installation
Additional requirements and considerations when installing the United Manufacturing Hub on a virtual machine.
This page describes advanced requirements and considerations when installing the United Manufacturing Hub.
It is meant to be an additional guide for the Installation guide page.
You may also find these step-by-step installation guides helpful:
This page describes how to deploy the United Manufacturing Hub on Flatcar
Linux.
Here is a step-by-step guide on how to deploy the United Manufacturing Hub on
Flatcar Linux, a Linux distribution designed for
container workloads with high security and low maintenance. This will leverage
the UMH Device and Container Infrastructure.
The system can be installed either bare metal or in a virtual machine.
Before you begin
Ensure your system meets these minimum requirements:
4-core CPU
8 GB system RAM
32 GB available disk space
Internet access
You will also need the latest version of the iPXE boot image, suitable for your
system:
ipxe-x86_64-efi:
For modern systems, recommended for virtual machines.
For virtual machines, ensure UEFI boot is enabled when creating the VM.
Lastly, ensure you are on the same network as the device for SSH access post-installation.
System Preparation and Booting from iPXE
Identify the drive for Flatcar Linux installation. For virtual machines, this is
typically sda. For bare metal, the drive depends on your physical storage. The
troubleshooting section can help identify the correct drive.
Boot your device from the iPXE image. Consult your device or hypervisor
documentation for booting instructions.
At the first prompt, read and accept the license to proceed.
Next, configure your network settings. Select DHCP if uncertain.
The connection will be tested next. If it fails, revisit the network settings.
Ensure your device has internet access and no firewalls are blocking the connection.
Then, select the drive for Flatcar Linux installation.
A summary of the installation will appear. Check that everything is correct and
confirm to start the process.
Shortly after, you’ll see a green command line core@flatcar-0-install. Remove
the USB stick or the CD drive from the VM. The system will continue processing.
The installation will complete after a few minutes, and the system will reboot.
When you see the green core@flatcar-1-umh login prompt, the installation is
complete, and the device’s IP address will be displayed.
Installation time varies based on network speed and system performance.
Connect to the Device
With the system installed, access it via SSH.
For Windows 11 users, the default
Windows Terminal
is recommended. For other OS users, try MobaXTerm.
To do so, open you terminal of choice. We recommend the default
Windows Terminal,
or MobaXTerm if you are not on Windows 11.
Connect to the device using this command, substituting <ip-address> with your
device’s IP address:
ssh core@<ip-address>
When prompted, enter the default password for the core user: umh.
Troubleshooting
The Installation Stops at the First Green Login Prompt
If the installation halts at the first green login prompt, check the installation
status with:
systemctl status installer
A typical response for an ongoing installation will look like this:
● installer.service - Flatcar Linux Installer
     Loaded: loaded (/usr/lib/systemd/system/installer.service; static; vendor preset: enabled)
     Active: active (running) since Wed 2021-05-12 14:00:00 UTC; 1min 30s ago
If the status differs, the installation may have failed. Review the logs to
identify the issue.
Unsure Which Drive to Select
To determine the correct drive, refer to your device’s manual:
SATA drives (HDD or SSD): Typically labeled as sda.
NVMe drives: Usually labeled as nvm0n1.
For further verification, boot any Linux distribution on your device and execute:
lsblk
The output, resembling the following, will help identify the drive:
NAME   MAJ:MIN RM   SIZE RO TYPE MOUNTPOINT
sda      8:0    0 223.6G  0 disk
├─sda1   8:1    0   512M  0 part /boot
└─sda2   8:2    0 223.1G  0 part /
sdb      8:0    0  31.8G  0 disk
└─sdb1   8:1    0  31.8G  0 part /mnt/usb
In most cases, the correct drive is the first listed or the one not matching the
USB stick size.
No Resources in the Cluster
If you can access the cluster but see no resources, SSH into the edge device and
check the cluster status:
systemctl status k3s
If the status is not active (running), the cluster isn’t operational. Restart it with:
sudo systemctl restart k3s
If the cluster is active or restarting doesn’t resolve the issue, inspect the
installation logs:
systemctl status umh-install
systemctl status helm-install
Persistent errors may necessitate a system reinstallation.
I can’t SSH into the virtual machine
Ensure that your computer is on the same network as the virtual machine, with no
firewalls or VPNs blocking the connection.
What’s next
You can follow the Getting Started guide
to get familiar with the UMH stack.
If you already know your way around the United Manufacturing Hub, you can
follow the Administration guides to
configure the stack for production.
7.2 - Upgrading
This section contains all upgrade guides, from the Companion of the Management Console to the UMH stack.
7.2.1 - Upgrade to v0.15.0
This page describes how to upgrade the United Manufacturing Hub from version 0.14.0 to 0.15.0
This page describes how to upgrade the United Manufacturing Hub from version 0.14.0 to 0.15.0.
Before upgrading, remember to back up the
database,
Node-RED flows,
and your cluster configuration.
This page describes how to upgrade the United Manufacturing Hub from version 0.13.6 to 0.14.0
This page describes how to upgrade the United Manufacturing Hub from version 0.13.6 to 0.14.0.
Before upgrading, remember to back up the
database,
Node-RED flows,
and your cluster configuration.
This page describes how to upgrade the United Manufacturing Hub from version 0.13.6 to 0.13.7
This page describes how to upgrade the United Manufacturing Hub from version 0.13.6 to 0.13.7.
Before upgrading, remember to back up the
database,
Node-RED flows,
and your cluster configuration.
This page describes how to upgrade the United Manufacturing Hub to version 0.13.6
This page describes how to upgrade the United Manufacturing Hub to version 0.13.6.
Before upgrading, remember to back up the
database,
Node-RED flows,
and your cluster configuration.
This page describes how to upgrade the United Manufacturing Hub to version 0.10.6
This page describes how to upgrade the United Manufacturing Hub to version
0.10.6. Before upgrading, remember to back up the
database,
Node-RED flows,
and your cluster configuration.
All the following commands are to be run from the UMH instance’s shell.
Update Helm Repo
Fetch the latest Helm charts from the UMH repository:
Due to a limitation of Helm, we cannot automatically set grafana.env.GF_PLUGINS_ALLOW_LOADING_UNSIGNED_PLUGINS=umh-datasource,umh-v2-datasource.
You could either ignore this (if your network is not restricuted to a single domain) or set it manually in the Grafana deployment.
We are also not able to manually overwrite grafana.extraInitContainers[0].image=management.umh.app/oci/united-manufacturing-hub/grafana-umh.
You could either ignore this (if your network is not restricuted to a single domain) or set it manually in the Grafana deployment.
Host system
Open the /var/lib/rancher/k3s/agent/etc/containerd/config.toml.tmpl using vi as root and add the following lines:
version = 2[plugins."io.containerd.internal.v1.opt"]
path = "/var/lib/rancher/k3s/agent/containerd"[plugins."io.containerd.grpc.v1.cri"]
stream_server_address = "127.0.0.1"stream_server_port = "10010"enable_selinux = falseenable_unprivileged_ports = trueenable_unprivileged_icmp = truesandbox_image = "management.umh.app/v2/rancher/mirrored-pause:3.6"[plugins."io.containerd.grpc.v1.cri".containerd]
snapshotter = "overlayfs"disable_snapshot_annotations = true[plugins."io.containerd.grpc.v1.cri".cni]
bin_dir = "/var/lib/rancher/k3s/data/ab2055bc72380bad965b219e8688ac02b2e1b665cad6bdde1f8f087637aa81df/bin"conf_dir = "/var/lib/rancher/k3s/agent/etc/cni/net.d"[plugins."io.containerd.grpc.v1.cri".containerd.runtimes.runc]
runtime_type = "io.containerd.runc.v2"[plugins."io.containerd.grpc.v1.cri".containerd.runtimes.runc.options]
SystemdCgroup = true[plugins."io.containerd.grpc.v1.cri".registry.mirrors]
# Mirror configuration for Docker Hub with fallback[plugins."io.containerd.grpc.v1.cri".registry.mirrors."docker.io"]
endpoint = ["https://management.umh.app/oci", "https://registry-1.docker.io"]
# Mirror configuration for GitHub Container Registry with fallback[plugins."io.containerd.grpc.v1.cri".registry.mirrors."ghcr.io"]
endpoint = ["https://management.umh.app/oci", "https://ghcr.io"]
# Mirror configuration for Quay with fallback[plugins."io.containerd.grpc.v1.cri".registry.mirrors."quay.io"]
endpoint = ["https://management.umh.app/oci", "https://quay.io"]
# Catch-all configuration for any other registries[plugins."io.containerd.grpc.v1.cri".registry.mirrors."*"]
endpoint = ["https://management.umh.app/oci"]
Open /etc/flatcar/update.conf using vi as root and add the following lines:
This page describes how to perform the upgrades that are available for the Management Console.
Easily upgrade your UMH instance with the Management Console. This page offers clear, step-by-step instructions
for a smooth upgrade process.
Before you begin
Before proceeding with the upgrade of the Companion, ensure that you have the following:
A functioning UMH instance, verified as “online” and in good health.
A reliable internet connection.
Familiarity with the changelog of the new version you are upgrading to, especially to identify any breaking changes
or required manual interventions.
Management Companion
Upgrade your UMH instance seamlessly using the Management Console. Follow these steps:
Identify Outdated Instance
From the Overview tab, check for an upgrade icon next to your instance’s name, signaling an outdated Companion version.
Additionally, locate the Upgrade Companion button at the bottom of the tab.
Start the Upgrade
When you’re prepared to upgrade your UMH instance, start by pressing the Upgrade Companion button. This will open a modal,
initially displaying a changelog with a quick overview of the latest changes. You can expand the changelog for a detailed view
from your current version up to the latest one. Additionally, it may highlight any warnings requiring manual intervention.
Navigate through the changelog, and when comfortable, proceed by clicking the Next button. This step grants you access to
crucial information about recommended actions and precautions during the upgrade process.
With the necessary insights, take the next step by clicking the Upgrade button. The system will guide you through the upgrade
process, displaying real-time progress updates, including a progress bar and logs.
Upon successful completion, a confirmation message will appear. Simply click the Let’s Go button to return to the dashboard,
where you can seamlessly continue using your UMH instance with the latest enhancements.
United Manufacturing Hub
As of now, the upgrade of the UMH is not yet included in the Management Console, meaning that it has to be performed
manually. However, it is planned to be included in the future. Until then, you can follow the instructions in the
What’s New page.
Troubleshooting
I encountered an issue during the upgrade process. What should I do?
If you encounter issues during the upgrade process, consider the following steps:
Retry the Process: Sometimes, a transient issue may cause a hiccup. Retry the upgrade process to ensure it’s not a
temporary glitch.
Check Logs: Review the logs displayed during the upgrade process for any error messages or indications of what might
be causing the problem. This information can offer insights into potential issues.
If the problem persists after retrying and checking the logs, and you’ve confirmed that all prerequisites are met, please
reach out to our support team for assistance.
I installed the Management Companion before the 0.1.0 release. How do I upgrade it?
If you installed the Management Companion before the 0.1.0 release, you will need to reinstall it. This is because
we made some changes that are not compatible with the previous version.
Before reinstalling the Management Companion, you have to backup your configuration, so that you can restore
your connections after the upgrade. To do so, follow these steps:
Access your UMH instance via SSH.
Run the following command to backup your configuration:
sudo $(which kubectl) get configmap/mgmtcompanion-config --kubeconfig /etc/rancher/k3s/k3s.yaml -n mgmtcompanion -o=jsonpath='{.data}' | sed -e 's/^/{"data":/' | sed -e 's/$/}/'> mgmtcompanion-config.bak.json
This will create a file called mgmtcompanion-config.bak.json in your current directory.
For good measure, copy the file to your local machine:
Replace <user> with your username, and <ip> with the IP address of your UMH instance. You will be prompted
for your password.
Now you can reinstall the Management Companion. Follow the instructions in the Installation
guide. Your data will be preserved, and you will be able to restore your connections.
After the installation is complete, you can restore your connections by running
the following command:
The old Data Model will continue to work, and all the data will be still available.
Before you begin
You need to have a UMH cluster. If you do not already have a cluster, you can
create one by following the Getting Started
guide.
You also need to access the system where the cluster is running, either by
logging into it or by using a remote shell.
Upgrade Your Companion to the Latest Version
If you haven’t already, upgrade your Companion to the latest version. You can
easily do this from the Management Console by selecting your Instance and
clicking on the “Upgrade” button.
Upgrade the Helm Chart
The new Data Model was introduced in the 0.10 release of the Helm Chart. To upgrade
to the latest 0.10 release, you first need to update the Helm Chart to the latest
0.9 release and then upgrade to the latest 0.10 release.
There is no automatic way (yet!) to upgrade the Helm Chart, so you need to follow
the manual steps below.
First, after accessing your instance, find the Helm Chart version you are currently
using by running the following command:
Then, head to the upgrading archive
and follow the instructions to upgrade from your current version to the latest
version, one version at a time.
7.2.8 - Archive
This section is meant to archive the upgrading guides for the different versions of
the United Manufacturing Hub.
The United Manufacturing Hub is a continuously evolving product. This means that
new features and bug fixes are added to the product on a regular basis. This
section contains the upgrading guides for the different versions the United
Manufacturing Hub.
The upgrading process is done by upgrading the Helm chart.
7.2.8.1 - Upgrade to v0.9.34
This page describes how to upgrade the United Manufacturing Hub to version 0.9.34
This page describes how to upgrade the United Manufacturing Hub to version
0.9.34. Before upgrading, remember to backup the
database,
Node-RED flows,
and your cluster configuration.
All the following commands are to be run from the UMH instance’s shell.
Update Helm Repo
Fetch the latest Helm charts from the UMH repository:
This page describes how to upgrade the United Manufacturing Hub to version 0.9.15
This page describes how to upgrade the United Manufacturing Hub to version
0.9.15. Before upgrading, remember to backup the
database,
Node-RED flows,
and your cluster configuration.
Add Helm repo in UMHLens / OpenLens
Check if the UMH Helm repository is added in UMHLens / OpenLens.
To do so, from the top-left menu, select FIle > Preferences (or press CTRL + ,).
Click on the Kubernetes tab and check if the Helm Chart section contains
the https://repo.umh.app repository.
If it doesn’t, click the Add Custom Helm Repo button and fill in the following
values:
Some workloads need to be deleted before upgrading. This process does not delete
any data, but it will cause downtime. If a workload is missing, it means that it
was not enabled in your cluster, therefore you can skip it.
To delete a resource, you can select it using the box on the left of the
resource name and click the - button on the bottom right corner.
Open the Workloads tab.
From the Deployment section, delete the following deployments:
From the StatefulSet section, delete the following statefulsets:
united-manufacturing-hub-hivemqce
united-manufacturing-hub-kafka
united-manufacturing-hub-nodered
united-manufacturing-hub-sensorconnect
united-manufacturing-hub-mqttbridge
Open the Network tab.
From the Services section, delete the following services:
united-manufacturing-hub-kafka
Upgrade Helm Chart
Now everything is ready to upgrade the Helm chart.
Navigate to the Helm > Releases tab.
Select the united-manufacturing-hub release and click
Upgrade.
In the Helm Upgrade window, make sure that the Upgrade version field
contains the version you want to upgrade to.
You can also change the values of the Helm chart, if needed.
If you want to activate the new databridge you need to add & edit the following section
_000_commonConfig:...datamodel_v2:enabled:truebridges:- mode:mqtt-kafkabrokerA:united-manufacturing-hub-mqtt:1883# The flow is always from A->B, for omni-directional flow, setup a 2nd bridge with reversed broker setupbrokerB:united-manufacturing-hub-kafka:9092topic:umh.v1..* # accept mqtt or kafka topic format. after the topic seprator, you can use# for mqtt wildcard, or .* for kafka wildcardtopicMergePoint:5# This is a new feature of our datamodel_old, which splits topics in topic and key (only in Kafka), preventing having lots of topicspartitions: 6 # optional: number of partitions for the new kafka topic. default:6replicationFactor: 1 # optional: replication factor for the new kafka topic. default:1...
You can also enable the new container registry by changing the values in the
image or image.repository fields from unitedmanufacturinghub/<image-name>
to ghcr.io/united-manufacturing-hub/<image-name>.
Click Upgrade.
The upgrade process can take a few minutes. The upgrade is complete when the
Status field of the release is Deployed.
7.2.8.3 - Upgrade to v0.9.14
This page describes how to upgrade the United Manufacturing Hub to version 0.9.14
This page describes how to upgrade the United Manufacturing Hub to version
0.9.14. Before upgrading, remember to backup the
database,
Node-RED flows,
and your cluster configuration.
Add Helm repo in UMHLens / OpenLens
Check if the UMH Helm repository is added in UMHLens / OpenLens.
To do so, from the top-left menu, select FIle > Preferences (or press CTRL + ,).
Click on the Kubernetes tab and check if the Helm Chart section contains
the https://repo.umh.app repository.
If it doesn’t, click the Add Custom Helm Repo button and fill in the following
values:
Some workloads need to be deleted before upgrading. This process does not delete
any data, but it will cause downtime. If a workload is missing, it means that it
was not enabled in your cluster, therefore you can skip it.
To delete a resource, you can select it using the box on the left of the
resource name and click the - button on the bottom right corner.
Open the Workloads tab.
From the Deployment section, delete the following deployments:
From the StatefulSet section, delete the following statefulsets:
united-manufacturing-hub-hivemqce
united-manufacturing-hub-kafka
united-manufacturing-hub-nodered
united-manufacturing-hub-sensorconnect
united-manufacturing-hub-mqttbridge
Open the Network tab.
From the Services section, delete the following services:
united-manufacturing-hub-kafka
Upgrade Helm Chart
Now everything is ready to upgrade the Helm chart.
Navigate to the Helm > Releases tab.
Select the united-manufacturing-hub release and click
Upgrade.
In the Helm Upgrade window, make sure that the Upgrade version field
contains the version you want to upgrade to.
You can also change the values of the Helm chart, if needed. For example,
if you want to apply the new tweaks to the resources in order to avoid the
Out Of Memory crash of the MQTT Broker, you can change the following values:
You can also enable the new container registry by changing the values in the
image or image.repository fields from unitedmanufacturinghub/<image-name>
to ghcr.io/united-manufacturing-hub/<image-name>.
Click Upgrade.
The upgrade process can take a few minutes. The upgrade is complete when the
Status field of the release is Deployed.
7.2.8.4 - Upgrade to v0.9.13
This page describes how to upgrade the United Manufacturing Hub to version 0.9.13
This page describes how to upgrade the United Manufacturing Hub to version
0.9.13. Before upgrading, remember to backup the
database,
Node-RED flows,
and your cluster configuration.
Add Helm repo in UMHLens / OpenLens
Check if the UMH Helm repository is added in UMHLens / OpenLens.
To do so, from the top-left menu, select FIle > Preferences (or press CTRL + ,).
Click on the Kubernetes tab and check if the Helm Chart section contains
the https://repo.umh.app repository.
If it doesn’t, click the Add Custom Helm Repo button and fill in the following
values:
Some workloads need to be deleted before upgrading. This process does not delete
any data, but it will cause downtime. If a workload is missing, it means that it
was not enabled in your cluster, therefore you can skip it.
To delete a resource, you can select it using the box on the left of the
resource name and click the - button on the bottom right corner.
Open the Workloads tab.
From the Deployment section, delete the following deployments:
From the StatefulSet section, delete the following statefulsets:
united-manufacturing-hub-mqttbridge
united-manufacturing-hub-hivemqce
united-manufacturing-hub-nodered
united-manufacturing-hub-sensorconnect
Upgrade Helm Chart
Now everything is ready to upgrade the Helm chart.
Navigate to the Helm > Releases tab.
Select the united-manufacturing-hub release and click
Upgrade.
In the Helm Upgrade window, make sure that the Upgrade version field
contains the version you want to upgrade to.
You can also change the values of the Helm chart, if needed.
Click Upgrade.
The upgrade process can take a few minutes. The upgrade is complete when the
Status field of the release is Deployed.
7.2.8.5 - Upgrade to v0.9.12
This page describes how to upgrade the United Manufacturing Hub to version 0.9.12
This page describes how to upgrade the United Manufacturing Hub to version
0.9.12. Before upgrading, remember to backup the
database,
Node-RED flows,
and your cluster configuration.
Add Helm repo in UMHLens / OpenLens
Check if the UMH Helm repository is added in UMHLens / OpenLens.
To do so, from the top-left menu, select FIle > Preferences (or press CTRL + ,).
Click on the Kubernetes tab and check if the Helm Chart section contains
the https://repo.umh.app repository.
If it doesn’t, click the Add Custom Helm Repo button and fill in the following
values:
This step is only needed if you enabled RBAC for the MQTT Broker and changed the
default password. If you did not change the default password, you can skip this
step.
Navigate to Config > ConfigMaps.
Select the united-manufacturing-hub-hivemqce-extension
ConfigMap.
Copy the content of credentials.xml and save it in a safe place.
Clear Workloads
Some workloads need to be deleted before upgrading. This process does not delete
any data, but it will cause downtime. If a workload is missing, it means that it
was not enabled in your cluster, therefore you can skip it.
To delete a resource, you can select it using the box on the left of the
resource name and click the - button on the bottom right corner.
Open the Workloads tab.
From the Deployment section, delete the following deployments:
From the StatefulSet section, delete the following statefulsets:
united-manufacturing-hub-mqttbridge
united-manufacturing-hub-hivemqce
united-manufacturing-hub-nodered
united-manufacturing-hub-sensorconnect
Remove MQTT Broker extension PVC
In this version we reduced the size of the MQTT Broker extension PVC. To do so,
we need to delete the old PVC and create a new one. This process will set the
credentials of the MQTT Broker to the default ones. If you changed the default
password, you can restore them after the upgrade.
Navigate to Storage > Persistent Volume Claims.
Select the united-manufacturing-hub-hivemqce-claim-extensions PVC and
click Delete.
Upgrade Helm Chart
Now everything is ready to upgrade the Helm chart.
Navigate to the Helm > Releases tab.
Select the united-manufacturing-hub release and click
Upgrade.
In the Helm Upgrade window, make sure that the Upgrade version field
contains the version you want to upgrade to.
There are some incompatible changes in this version. To avoid errors, you
need to change the following values:
console:console:config:kafka:tls:passphrase:""# <- remove this line
console.extraContainers: remove the property and its content.
console:extraContainers:{}# <- remove this line
console.extraEnv: remove the property and its content.
console:extraEnv:""# <- remove this line
console.extraEnvFrom: remove the property and its content.
console:extraEnvFrom:""# <- remove this line
console.extraVolumeMounts: remove the |- characters right after the
property name. It should look like this:
console:extraVolumeMounts:# <- remove the `|-` characters in this line- name:united-manufacturing-hub-kowl-certificatesmountPath:/SSL_certs/kafkareadOnly:true
console.extraVolumes: remove the |- characters right after the
property name. It should look like this:
console:extraVolumes:# <- remove the `|-` characters in this line- name:united-manufacturing-hub-kowl-certificatessecret:secretName:united-manufacturing-hub-kowl-secrets
Change the console.service property to the following:
redis.sentinel: remove the property and its content.
redis:sentinel:{}# <- remove all the content of this section
Remove the property redis.master.command:
redis:master:command:/run.sh# <- remove this line
timescaledb-single.fullWalPrevention: remove the property and its content.
timescaledb-single:fullWalPrevention:# <- remove this linecheckFrequency:30# <- remove this lineenabled:false# <- remove this linethresholds:# <- remove this linereadOnlyFreeMB:64# <- remove this linereadOnlyFreePercent:5# <- remove this linereadWriteFreeMB:128# <- remove this linereadWriteFreePercent:8# <- remove this line
timescaledb-single.loadBalancer: remove the property and its content.
timescaledb-single:loadBalancer:# <- remove this lineannotations:# <- remove this lineservice.beta.kubernetes.io/aws-load-balancer-connection-idle-timeout:"4000"# <- remove this lineenabled:true# <- remove this lineport:5432# <- remove this line
timescaledb-single.replicaLoadBalancer: remove the property and its content.
timescaledb-single:replicaLoadBalancer:annotations:# <- remove this lineservice.beta.kubernetes.io/aws-load-balancer-connection-idle-timeout:"4000"# <- remove this lineenabled:false# <- remove this lineport:5432# <- remove this line
timescaledb-single.secretNames: remove the property and its content.
timescaledb-single:secretNames:{}# <- remove this line
timescaledb-single.unsafe: remove the property and its content.
timescaledb-single:unsafe:false# <- remove this line
Change the value of the timescaledb-single.service.primary.type property
to LoadBalancer:
The upgrade process can take a few minutes. The upgrade is complete when the
Status field of the release is Deployed.
7.2.8.6 - Upgrade to v0.9.11
This page describes how to upgrade the United Manufacturing Hub to version 0.9.11
This page describes how to upgrade the United Manufacturing Hub to version
0.9.11. Before upgrading, remember to backup the
database,
Node-RED flows,
and your cluster configuration.
Add Helm repo in UMHLens / OpenLens
Check if the UMH Helm repository is added in UMHLens / OpenLens.
To do so, from the top-left menu, select FIle > Preferences (or press CTRL + ,).
Click on the Kubernetes tab and check if the Helm Chart section contains
the https://repo.umh.app repository.
If it doesn’t, click the Add Custom Helm Repo button and fill in the following
values:
Some workloads need to be deleted before upgrading. This process does not delete
any data, but it will cause downtime. If a workload is missing, it means that it
was not enabled in your cluster, therefore you can skip it.
To delete a resource, you can select it using the box on the left of the
resource name and click the - button on the bottom right corner.
Open the Workloads tab.
From the Deployment section, delete the following deployments:
From the StatefulSet section, delete the following statefulsets:
united-manufacturing-hub-mqttbridge
united-manufacturing-hub-hivemqce
united-manufacturing-hub-nodered
united-manufacturing-hub-sensorconnect
Upgrade Helm Chart
Now everything is ready to upgrade the Helm chart.
Navigate to the Helm > Releases tab.
Select the united-manufacturing-hub release and click
Upgrade.
In the Helm Upgrade window, make sure that the Upgrade version field
contains the version you want to upgrade to.
You can also change the values of the Helm chart, if needed.
Click Upgrade.
The upgrade process can take a few minutes. The upgrade is complete when the
Status field of the release is Deployed.
7.2.8.7 - Upgrade to v0.9.10
This page describes how to upgrade the United Manufacturing Hub to version 0.9.10
This page describes how to upgrade the United Manufacturing Hub to version
0.9.10. Before upgrading, remember to backup the
database,
Node-RED flows,
and your cluster configuration.
Add Helm repo in UMHLens / OpenLens
Check if the UMH Helm repository is added in UMHLens / OpenLens.
To do so, from the top-left menu, select FIle > Preferences (or press CTRL + ,).
Click on the Kubernetes tab and check if the Helm Chart section contains
the https://repo.umh.app repository.
If it doesn’t, click the Add Custom Helm Repo button and fill in the following
values:
In this release, the Grafana version has been updated from 8.5.9 to 9.3.1.
Check the release notes for
further information about the changes.
Additionally, the way default plugins are installed has changed. Unfortunatly,
it is necesary to manually install all the plugins that were previously installed.
If you didn’t install any plugin other than the default ones, you can skip this
section.
Follow these steps to see the list of plugins installed in your cluster:
Open the browser and go to the Grafana dashboard.
Navigate to the Configuration > Plugins tab.
Select the Installed filter.
Write down all the plugins that you manually installed. You can recognize
them by not having the Core tag.
The following ones are installed by default, therefore you can skip them:
ACE.SVG by Andrew Rodgers
Button Panel by UMH Systems Gmbh
Button Panel by CloudSpout LLC
Discrete by Natel Energy
Dynamic Text by Marcus Olsson
FlowCharting by agent
Pareto Chart by isaozler
Pie Chart (old) by Grafana Labs
Timepicker Buttons Panel by williamvenner
UMH Datasource by UMH Systems Gmbh
Untimely by factry
Worldmap Panel by Grafana Labs
Clear Workloads
Some workloads need to be deleted before upgrading. This process does not delete
any data, but it will cause downtime. If a workload is missing, it means that it
was not enabled in your cluster, therefore you can skip it.
To delete a resource, you can select it using the box on the left of the
resource name and click the - button on the bottom right corner.
Open the Workloads tab.
From the Deployment section, delete the following deployments:
The upgrade process can take a few minutes. The upgrade is complete when the
Status field of the release is Deployed.
Afterwards, you can reinstall the additional Grafana plugins.
Replace VerneMQ with HiveMQ
In this upgrade we switched from using VerneMQ to HiveMQ as our MQTT Broker
(you can read the
blog article
about it).
While this process is fully backwards compatible, we suggest to update NodeRed
flows and any other additional service that uses MQTT, to use the new service
broker called united-manufacturing-hub-mqtt. The old
united-manufacturing-hub-vernemq is still functional and,
despite the name, also points to HiveMQ, but in future upgrades will be removed.
Please double-check if all of your services can connect to the new MQTT broker.
It might be needed for them to be restarted, so that they can resolve the DNS
name and get the new IP. Also, it can happen with tools like chirpstack, that you
need to specify the client-id as the automatically generated ID worked with
VerneMQ, but is now declined by HiveMQ.
Troubleshooting
Some microservices can’t connect to the new MQTT broker
If you are using the united-manufacturing-hub-mqtt service,
but some microservice can’t connect to it, restarting the microservice might
solve the issue. To do so, you can delete the Pod of the microservice and let
Kubernetes recreate it.
ChirpStack can’t connect to the new MQTT broker
ChirpStack uses a generated client-id to connect to the MQTT broker. This
client-id is not accepted by HiveMQ. To solve this issue, you can set the
client_id field in the integration.mqtt section of the chirpstack configuration
file to a fixed value:
This page describes how to upgrade the United Manufacturing Hub to version 0.9.9
This page describes how to upgrade the United Manufacturing Hub to version
0.9.9. Before upgrading, remember to backup the
database,
Node-RED flows,
and your cluster configuration.
Add Helm repo in UMHLens / OpenLens
Check if the UMH Helm repository is added in UMHLens / OpenLens.
To do so, from the top-left menu, select FIle > Preferences (or press CTRL + ,).
Click on the Kubernetes tab and check if the Helm Chart section contains
the https://repo.umh.app repository.
If it doesn’t, click the Add Custom Helm Repo button and fill in the following
values:
Some workloads need to be deleted before upgrading. This process does not delete
any data, but it will cause downtime. If a workload is missing, it means that it
was not enabled in your cluster, therefore you can skip it.
To delete a resource, you can select it using the box on the left of the
resource name and click the - button on the bottom right corner.
Open the Workloads tab.
From the Deployment section, delete the following deployments:
From the StatefulSet section, delete the following statefulsets:
united-manufacturing-hub-mqttbridge
united-manufacturing-hub-hivemqce
united-manufacturing-hub-nodered
united-manufacturing-hub-sensorconnect
Upgrade Helm Chart
Now everything is ready to upgrade the Helm chart.
Navigate to the Helm > Releases tab.
Select the united-manufacturing-hub release and click
Upgrade.
In the Helm Upgrade window, make sure that the Upgrade version field
contains the version you want to upgrade to.
You can also change the values of the Helm chart, if needed.
In the grafana section, find the extraInitContainers field and change the
value of the image field to unitedmanufacturinghub/grafana-plugin-extractor:0.1.4.
Click Upgrade.
The upgrade process can take a few minutes. The upgrade is complete when the
Status field of the release is Deployed.
7.2.8.9 - Upgrade to v0.9.8
This page describes how to upgrade the United Manufacturing Hub to version 0.9.8
This page describes how to upgrade the United Manufacturing Hub to version
0.9.8. Before upgrading, remember to backup the
database,
Node-RED flows,
and your cluster configuration.
Add Helm repo in UMHLens / OpenLens
Check if the UMH Helm repository is added in UMHLens / OpenLens.
To do so, from the top-left menu, select FIle > Preferences (or press CTRL + ,).
Click on the Kubernetes tab and check if the Helm Chart section contains
the https://repo.umh.app repository.
If it doesn’t, click the Add Custom Helm Repo button and fill in the following
values:
Some workloads need to be deleted before upgrading. This process does not delete
any data, but it will cause downtime. If a workload is missing, it means that it
was not enabled in your cluster, therefore you can skip it.
To delete a resource, you can select it using the box on the left of the
resource name and click the - button on the bottom right corner.
Open the Workloads tab.
From the Deployment section, delete the following deployments:
From the StatefulSet section, delete the following statefulsets:
united-manufacturing-hub-mqttbridge
united-manufacturing-hub-hivemqce
united-manufacturing-hub-nodered
united-manufacturing-hub-sensorconnect
Upgrade Helm Chart
Now everything is ready to upgrade the Helm chart.
Navigate to the Helm > Releases tab.
Select the united-manufacturing-hub release and click
Upgrade.
In the Helm Upgrade window, make sure that the Upgrade version field
contains the version you want to upgrade to.
You can also change the values of the Helm chart, if needed.
Click Upgrade.
The upgrade process can take a few minutes. The upgrade is complete when the
Status field of the release is Deployed.
7.2.8.10 - Upgrade to v0.9.7
This page describes how to upgrade the United Manufacturing Hub to version 0.9.7
This page describes how to upgrade the United Manufacturing Hub to version
0.9.7. Before upgrading, remember to backup the
database,
Node-RED flows,
and your cluster configuration.
Add Helm repo in UMHLens / OpenLens
Check if the UMH Helm repository is added in UMHLens / OpenLens.
To do so, from the top-left menu, select FIle > Preferences (or press CTRL + ,).
Click on the Kubernetes tab and check if the Helm Chart section contains
the https://repo.umh.app repository.
If it doesn’t, click the Add Custom Helm Repo button and fill in the following
values:
Some workloads need to be deleted before upgrading. This process does not delete
any data, but it will cause downtime. If a workload is missing, it means that it
was not enabled in your cluster, therefore you can skip it.
To delete a resource, you can select it using the box on the left of the
resource name and click the - button on the bottom right corner.
Open the Workloads tab.
From the Deployment section, delete the following deployments:
In the timescaledb-single section, make sure that the image.tag field
is set to pg13.8-ts2.8.0-p1.
Click Upgrade.
The upgrade process can take a few minutes. The upgrade is complete when the
Status field of the release is Deployed.
Change Factoryinsight API version
The Factoryinsight API version has changed from v1 to v2. To make sure that
you are using the new version, click on any Factoryinsight Pod and check that the
VERSION environment variable is set to 2.
If it’s not, follow these steps:
Navigate to the Workloads > Deployments tab.
Select the united-manufacturing-hub-factoryinsight-deployment deployment.
Click the Edit button to open the deployment’s configuration.
Find the spec.template.spec.containers[0].env field.
Set the value field of the VERSION variable to 2.
7.2.8.11 - Upgrade to v0.9.6
This page describes how to upgrade the United Manufacturing Hub to version 0.9.6
This page describes how to upgrade the United Manufacturing Hub to version
0.9.6. Before upgrading, remember to backup the
database,
Node-RED flows,
and your cluster configuration.
Add Helm repo in UMHLens / OpenLens
Check if the UMH Helm repository is added in UMHLens / OpenLens.
To do so, from the top-left menu, select FIle > Preferences (or press CTRL + ,).
Click on the Kubernetes tab and check if the Helm Chart section contains
the https://repo.umh.app repository.
If it doesn’t, click the Add Custom Helm Repo button and fill in the following
values:
This command could take a while to complete, especially on larger tables.
Type exit to close the shell.
Clear Workloads
Some workloads need to be deleted before upgrading. This process does not delete
any data, but it will cause downtime. If a workload is missing, it means that it
was not enabled in your cluster, therefore you can skip it.
To delete a resource, you can select it using the box on the left of the
resource name and click the - button on the bottom right corner.
Open the Workloads tab.
From the Deployment section, delete the following deployments:
From the StatefulSet section, delete the following statefulsets:
united-manufacturing-hub-mqttbridge
united-manufacturing-hub-hivemqce
united-manufacturing-hub-nodered
united-manufacturing-hub-sensorconnect
Upgrade Helm Chart
Now everything is ready to upgrade the Helm chart.
Navigate to the Helm > Releases tab.
Select the united-manufacturing-hub release and click
Upgrade.
In the Helm Upgrade window, make sure that the Upgrade version field
contains the version you want to upgrade to.
You can also change the values of the Helm chart, if needed.
Click Upgrade.
The upgrade process can take a few minutes. The upgrade is complete when the
Status field of the release is Deployed.
7.2.8.12 - Upgrade to v0.9.5
This page describes how to upgrade the United Manufacturing Hub to version 0.9.5
This page describes how to upgrade the United Manufacturing Hub to version
0.9.5. Before upgrading, remember to backup the
database,
Node-RED flows,
and your cluster configuration.
Add Helm repo in UMHLens / OpenLens
Check if the UMH Helm repository is added in UMHLens / OpenLens.
To do so, from the top-left menu, select FIle > Preferences (or press CTRL + ,).
Click on the Kubernetes tab and check if the Helm Chart section contains
the https://repo.umh.app repository.
If it doesn’t, click the Add Custom Helm Repo button and fill in the following
values:
Now you can close the shell by typing exit and continue with the upgrade process.
Clear Workloads
Some workloads need to be deleted before upgrading. This process does not delete
any data, but it will cause downtime. If a workload is missing, it means that it
was not enabled in your cluster, therefore you can skip it.
To delete a resource, you can select it using the box on the left of the
resource name and click the - button on the bottom right corner.
Open the Workloads tab.
From the Deployment section, delete the following deployments:
end_time_stamp has been renamed to timestamp_ms_end
deleteShiftByAssetIdAndBeginTimestamp and deleteShiftById have been removed.
Use the deleteShift
message instead.
7.2.8.13 - Upgrade to v0.9.4
This page describes how to upgrade the United Manufacturing Hub to version 0.9.4
This page describes how to upgrade the United Manufacturing Hub to version
0.9.4. Before upgrading, remember to backup the
database,
Node-RED flows,
and your cluster configuration.
Add Helm repo in UMHLens / OpenLens
Check if the UMH Helm repository is added in UMHLens / OpenLens.
To do so, from the top-left menu, select FIle > Preferences (or press CTRL + ,).
Click on the Kubernetes tab and check if the Helm Chart section contains
the https://repo.umh.app repository.
If it doesn’t, click the Add Custom Helm Repo button and fill in the following
values:
Some workloads need to be deleted before upgrading. This process does not delete
any data, but it will cause downtime. If a workload is missing, it means that it
was not enabled in your cluster, therefore you can skip it.
To delete a resource, you can select it using the box on the left of the
resource name and click the - button on the bottom right corner.
Open the Workloads tab.
From the Deployment section, delete the following deployments:
If you have enabled Barcodereader,
find the barcodereader section and set the
following values, adding the missing ones and updating the already existing
ones:
enabled:falseimage:pullPolicy:IfNotPresentresources:requests:cpu:"2m"memory:"30Mi"limits:cpu:"10m"memory:"60Mi"scanOnly:false# Debug mode, will not send data to kafka
Click Upgrade.
The upgrade process can take a few minutes. The process is complete when the
Status field of the release is Deployed.
7.3 - Administration
This section describes how to manage and configure the United Manufacturing Hub
cluster.
In this section, you will find information about how to manage and configure the
United Manufacturing Hub cluster, from customizing the cluster to access the
different services.
7.3.1 - Access the Database
This page describes how to access the United Manufacturing Hub database to
perform SQL operations using a database client or the CLI.
There are multiple ways to access the database. If you want to just visualize data,
then using Grafana or a database client is the easiest way. If you need to also
perform SQL commands, then using a database client or the CLI are the best options.
Generally, using a database client gives you the most flexibility, since you can
both visualize the data and manipulate the database. However, it requires you to
install a database client on your machine.
Using the CLI gives you more control over the database, but it requires you to
have a good understanding of SQL.
Grafana comes with a pre-configured PostgreSQL datasource, so you can use it to
visualize the data.
Before you begin
You need to have a UMH cluster. If you do not already have a cluster, you can
create one by following the Getting Started
guide.
You also need to access the system where the cluster is running, either by
logging into it or by using a remote shell.
Get the database credentials
If you are not using the CLI, you need to know the database credentials. You can
find them in the timescale-post-init-pw Secret. Run the
following command to get the credentials:
For the sake of this tutorial, pgAdmin will be used as an example, but other clients
have similar functionality. Refer to the specific client documentation for more
information.
Using pgAdmin
You can use pgAdmin to access the database. To do so,
you need to install the pgAdmin client on your machine. For more information, see
the pgAdmin documentation.
Once you have installed the client, you can add a new server from the main window.
In the General tab, give the server a meaningful name. In the Connection
tab, enter the database credentials:
The Host name/address is the IP address of your instance.
The Port is 5432.
The Maintenance database is postgres.
The Username and Password are the ones you found in the Secret.
Click Save to save the server.
You can now connect to the database by double-clicking the server.
Use the side menu to navigate through the server. The tables are listed under
the Schemas > public > Tables section of the factoryinsight database.
Refer to the pgAdmin documentation
for more information on how to use the client to perform database operations.
Access the database using the command line interface
You can access the database from the command line using the psql command
directly from the united-manufacturing-hub-timescaledb-0 Pod.
You will not need credentials to access the database from the Pod’s CLI.
The following steps need to be performed from the machine where the cluster is
running, either by logging into it or by using a remote shell.
This page describes how to access services from within the cluster.
All the services deployed in the cluster are visible to each other. That makes it
easy to connect them together.
Before you begin
You need to have a UMH cluster. If you do not already have a cluster, you can
create one by following the Getting Started
guide.
You also need to access the system where the cluster is running, either by
logging into it or by using a remote shell.
Connect to a service from another service
To connect to a service from another service, you can use the service name as the
host name.
To get a list of available services and related ports you can run the following
command from the instance:
sudo $(which kubectl) get svc -n united-manufacturing-hub --kubeconfig /etc/rancher/k3s/k3s.yaml
All of them are available from within the cluster. The ones of type LoadBalancer
are also available from outside the cluster using the node IP and the port listed
in the Ports column.
Use the port on the left side of the colon (:) to connect to the service from
outside the cluster. For example, the database is available on port 5432.
Example
The most common use case is to connect to the MQTT Broker from Node-RED.
To do that, when you create the MQTT node, you can use the service name
united-manufacturing-hub-mqtt as the host name and one the ports
listed in the Ports column.
The MQTT service name has changed since version 0.9.10. If you are using an older
version, use united-manufacturing-hub-vernemq instead of
united-manufacturing-hub-mqtt.
This page describe how to access services from outside the cluster.
Some of the microservices in the United Manufacturing Hub are exposed outside
the cluster with a LoadBalancer service. A LoadBalancer is a service
that exposes a set of Pods on the same network as the cluster, but
not necessarily to the entire internet. The LoadBalancer service
provides a single IP address that can be used to access the Pods.
Before you begin
You need to have a UMH cluster. If you do not already have a cluster, you can
create one by following the Getting Started
guide.
You also need to access the system where the cluster is running, either by
logging into it or by using a remote shell.
Accessing the services
To get a list of available services and related ports you can run the following
command from the instance:
sudo $(which kubectl) get svc -n united-manufacturing-hub --kubeconfig /etc/rancher/k3s/k3s.yaml
All of them are available from within the cluster. The ones of type LoadBalancer
are also available from outside the cluster using the node IP and the port listed
in the Ports column.
Use the port on the left side of the colon (:) to connect to the service from
outside the cluster. For example, the database is available on port 5432.
Services with LoadBalancer by default
The following services are exposed outside the cluster with a LoadBalancer
service by default:
To access Node-RED, you need to use the /nodered path, for example
http://192.168.1.100:1880/nodered.
Services with NodePort by default
The Kafka Broker uses the service
type NodePort by default.
Follow these steps to access the Kafka Broker outside the cluster:
Access your instance via SSH
Execute this command to check the host port of the Kafka Broker:
sudo $(which kubectl) get svc united-manufacturing-hub-kafka-external -n united-manufacturing-hub --kubeconfig /etc/rancher/k3s/k3s.yaml
In the PORT(S) column, you should be able to see the port with 9094:<host-port>/TCP.
To access the Kafka Broker, use <instance-ip-address>:<host-port>.
Services with ClusterIP
Some of the microservices in the United Manufacturing Hub are exposed via
a ClusterIP service. That means that they are only accessible from within the
cluster itself. There are two options for enabling access them from outside the cluster:
Creating a LoadBalancer service:
A LoadBalancer is a service that exposes a set of Pods on the same network
as the cluster, but not necessarily to the entire internet.
Port forwarding:
You can just forward the port of a service to your local machine.
Port forwarding can be unstable, especially if the connection to the cluster is
slow. If you are experiencing issues, try to create a LoadBalancer service
instead.
Create a LoadBalancer service
Follow these steps to enable the LoadBalancer service for the corresponding microservice:
Execute the following command to list the services and note the name of
the one you want to access.
sudo $(which kubectl) get svc -n united-manufacturing-hub --kubeconfig /etc/rancher/k3s/k3s.yaml
Start editing the service configuration by running this command:
Where <local-port> is the port on the host that you want to use,
and <remote-port> is the service port that you noted before.
Usually, it’s good practice to pick a high number (greater than 30000)
for the host port, in order to avoid conflicts.
You should be able to see logs like:
Forwarding from 127.0.0.1:31922 -> 9121
Forwarding from [::1]:31922 -> 9121
Handling connection for 31922
You can now access the service using the IP address of the node and
the port you choose.
Security considerations
MQTT broker
There are some security considerations to keep in mind when exposing the MQTT
broker.
By default, the MQTT broker is configured to allow anonymous connections. This
means that anyone can connect to the broker without providing any credentials.
This is not recommended for production environments.
To secure the MQTT broker, you can configure it to require authentication. For
that, you can either enable RBAC
or set up HiveMQ PKI (recommended
for production environments).
Troubleshooting
LoadBalancer service stuck in Pending state
If the LoadBalancer service is stuck in the Pending state, it probably means
that the host port is already in use. To fix this, edit the service and change
the section spec.ports.port to a different port number.
This page describes how to install custom drivers in NodeRed.
NodeRed is running on Alpine Linux as non-root user. This means that you can’t
install packages with apk. This tutorial shows you how to install packages
with proper security measures.
Before you begin
You need to have a UMH cluster. If you do not already have a cluster, you can
create one by following the Getting Started
guide.
You also need to access the system where the cluster is running, either by
logging into it or by using a remote shell.
This page describes how to execute Kafka shell scripts.
When working with Kafka, you may need to execute shell scripts to perform
administrative tasks. This page describes how to execute Kafka shell scripts.
Before you begin
You need to have a UMH cluster. If you do not already have a cluster, you can
create one by following the Getting Started
guide.
You also need to access the system where the cluster is running, either by
logging into it or by using a remote shell.
This page describes how to reduce the size of the United Manufacturing Hub database.
Over time, time-series data can consume a large amount of disk space. To reduce
the amount of disk space used by time-series data, there are three options:
Enable data compression. This reduces the required disk space by applying
mathematical compression to the data. This compression is lossless, so the data
is not changed in any way. However, it will take more time to compress and
decompress the data. For more information, see how
TimescaleDB compression works.
Enable data retention. This deletes old data that is no longer needed, by
setting policies that automatically delete data older than a specified time. This
can be beneficial for managing the size of the database, as well as adhering to
data retention regulations. However, by definition, data loss will occur. For
more information, see how
TimescaleDB data retention works.
Downsampling. This is a method of reducing the amount of data stored by
aggregating data points over a period of time. For example, you can aggregate
data points over a 30-minute period, instead of storing each data point. If exact
data is not required, downsampling can be useful to reduce database size.
However, data may be less accurate.
Before you begin
You need to have a UMH cluster. If you do not already have a cluster, you can
create one by following the Getting Started
guide.
You also need to access the system where the cluster is running, either by
logging into it or by using a remote shell.
You can find sample SQL commands to enable data compression here.
The first step is to turn on data compression on the target table, and set the compression options. Refer to the TimescaleDB documentation for a full list of options.
-- set "asset_id" as the key for the compressed segments and orders the table by "valuename".
ALTERTABLEprocessvaluetableSET(timescaledb.compress,timescaledb.compress_segmentby='asset_id',timescaledb.compress_orderby='valuename');
-- set "asset_id" as the key for the compressed segments and orders the table by "name".
ALTERTABLEtagSET(timescaledb.compress,timescaledb.compress_segmentby='asset_id',timescaledb.compress_orderby='name');
Then, you have to create the compression policy. The interval determines the age that the chunks of data need to reach before being compressed. Read the official documentation for more information.
-- set a compression policy on the "processvaluetable" table, which will compress data older than 7 days.
SELECTadd_compression_policy('processvaluetable',INTERVAL'7 days');
-- set a compression policy on the "tag" table, which will compress data older than 2 weeks.
SELECTadd_compression_policy('tag',INTERVAL'2 weeks');
Enable data retention
You can find sample SQL commands to enable data retention here.
Sample command for factoryinsight and umh_v2 databases:
Enabling data retention consists in only adding the policy with the desired
retention interval. Refer to the official documentation
for more detailed information about these queries.
-- Set a retention policy on the "processvaluetable" table, which will delete data older than 7 days.
SELECTadd_retention_policy('processvaluetable',INTERVAL'7 days');
-- set a retention policy on the "tag" table, which will delete data older than 3 months.
SELECTadd_retention_policy('tag',INTERVAL'3 months');
This page describes how to reduce the amount of Kafka Topics in order to
lower the overhead by using the merge point feature.
Kafka excels at processing a high volume of messages but can encounter difficulties
with excessive topics, which may lead to insufficient memory. The optimal Kafka
setup involves minimal topics, utilizing the
event key for logical
data segregation.
On the contrary, MQTT shines when handling a large number of topics with a small
number of messages. But when bridging MQTT to Kafka, the number of topics can
become overwhelming.
Specifically, with the default configuration, Kafka is able to handle around
100-150 topics. This is because there is a limit of 1000 partitions per broker,
and each topic requires has 6 partitions by default.
So, if you are experiencing memory issues with Kafka, you may want to consider
combining multiple topics into a single topic with different keys. The diagram
below illustrates how this principle simplifies topic management.
This tutorial is for advanced users. Contact us if you need assistance.
You need to have a UMH cluster. If you do not already have a cluster, you can
create one by following the Getting Started
guide.
You also need to access the system where the cluster is running, either by
logging into it or by using a remote shell.
There are two configurations for the topic merge point: one in the Companion
configuration for Benthos data sources and another in the Helm chart for data bridges.
Data Sources
To adjust the topic merge point for data sources, modify
mgmtcompanion-config configmap. This
can be easily done with the following command:
This command opens the current configuration in the default editor, allowing you
to set the umh_merge_point to your preferred value:
data:umh_merge_point:<numeric-value>
Ensure the value is at least 3 and update the lastUpdated field to the current
Unix timestamp to trigger the automatic refresh of existing data sources.
Data Bridge
For data bridges, the merge point is defined individually in the Helm chart values
for each bridge. Update the Helm chart installation with the new topicMergePoint
value for each bridge. See the Helm chart documentation
for more details.
Setting the topicMergePoint to -1 disables the merge feature.
7.3.9 - Delete Assets from the Database
This task shows you how to delete assets from the database.
This is useful if you have created assets by mistake, or to delete
the ones that are no longer needed.
This task deletes data from the database. Make sure you
have a backup of the database before you proceed.
Before you begin
You need to have a UMH cluster. If you do not already have a cluster, you can
create one by following the Getting Started
guide.
You also need to access the system where the cluster is running, either by
logging into it or by using a remote shell.
This command will open a psql shell connected to the default postgres database.
Connect to the factoryinsight database:
\c factoryinsight
Choose the assets to delete
You have multiple choices to delete assets, like deleting a single asset, or
deleting all assets in a location, or deleting all assets with a specific name.
To do so, you can customize the SQL command using different filters. Specifically,
a combination of the following filters:
assetid
location
customer
To filter an SQL command, you can use the WHERE clause. For example, using all
of the filters:
This command will open a psql shell connected to the default postgres database.
Connect to the umh_v2 database:
\c umh_v2
Choose the assets to delete
You have multiple choices to delete assets, like deleting a single asset, or
deleting all assets in a location, or deleting all assets with a specific name.
To do so, you can customize the SQL command using different filters. Specifically,
a combination of the following filters:
enterprise
site
area
line
workcell
origin_id
To filter an SQL command, you can use the WHERE clause. For example, you can filter
by enterprise, site, and area:
This page shows how to explore cached data in the United Manufacturing Hub.
When working with the United Manufacturing Hub, you might want to visualize
information about the cached data. This page shows how you can access the cache
and explore the data.
Before you begin
You need to have a UMH cluster. If you do not already have a cluster, you can
create one by following the Getting Started
guide.
You also need to access the system where the cluster is running, either by
logging into it or by using a remote shell.
Open a shell in the cache Pod
Get access to the instance’s shell and execute the following commands.
Download the backup scripts and extract the content in a folder of your choice.
For this task, you need to have PostgreSQL
installed on your machine.
You also need to have enough space on your machine to store the backup. To check
the size of the database, ssh into the system and follow the steps below:
To run the backup script, you’ll first need to obtain a copy of the Kubernetes
configuration file from your instance. This is essential for providing the
script with access to the instance.
In the shell of your instance, execute the following command to display the
Kubernetes configuration:
sudo cat /etc/rancher/k3s/k3s.yaml
Make sure to copy the entire output to your clipboard.
This tutorial is based on the assumption that your kubeconfig file is located
at /etc/rancher/k3s/k3s.yaml. Depending on your setup, the actual file location
might be different.
Open a text editor, like Notepad, on your local machine and paste the copied content.
In the pasted content, find the server field. It usually defaults to https://127.0.0.1:6443.
Replace this with your instance’s IP address
server:https://<INSTANCE_IP>:6443
Save the file as k3s.yaml inside the backup folder you downloaded earlier.
Backup using the script
The backup script is located inside the folder you downloaded earlier.
You can find a list of all available parameters down below.
If OutputPath is not set, the backup will be stored in the current folder.
This script might take a while to finish, depending on the size of your database
and your connection speed.
If the connection is interrupted, there is currently no option to resume the process, therefore you will need to start again.
Here is a list of all available parameters:
Available parameters
Parameter
Description
Required
Default value
GrafanaToken
Grafana API key
Yes
IP
IP of the cluster to backup
Yes
KubeconfigPath
Path to the kubeconfig file
Yes
DatabaseDatabase
Name of the databse to backup
No
factoryinsight
DatabasePassword
Password of the database user
No
changeme
DatabasePort
Port of the database
No
5432
DatabaseUser
Database user
No
factoryinsight
DaysPerJob
Number of days worth of data to backup in each parallel job
No
31
EnableGpgEncryption
Set to true if you want to encrypt the backup
No
false
EnableGpgSigning
Set to true if you want to sign the backup
No
false
GpgEncryptionKeyId
ID of the GPG key used for encryption
No
GpgSigningKeyId
ID of the GPG key used for signing
No
GrafanaPort
External port of the Grafana service
No
8080
OutputPath
Path to the folder where the backup will be stored
No
Current folder
ParallelJobs
Number of parallel job backups to run
No
4
SkipDiskSpaceCheck
Skip checking available disk space
No
false
SkipGpgQuestions
Set to true if you want to sign or encrypt the backup
No
false
Restore
Each component of the United Manufacturing Hub can be restored separately, in
order to allow for more flexibility and to reduce the damage in case of a
failure.
Copy kubeconfig file
To run the backup script, you’ll first need to obtain a copy of the Kubernetes
configuration file from your instance. This is essential for providing the
script with access to the instance.
In the shell of your instance, execute the following command to display the
Kubernetes configuration:
sudo cat /etc/rancher/k3s/k3s.yaml
Make sure to copy the entire output to your clipboard.
This tutorial is based on the assumption that your kubeconfig file is located
at /etc/rancher/k3s/k3s.yaml. Depending on your setup, the actual file location
might be different.
Open a text editor, like Notepad, on your local machine and paste the copied content.
In the pasted content, find the server field. It usually defaults to https://127.0.0.1:6443.
Replace this with your instance’s IP address
server:https://<INSTANCE_IP>:6443
Save the file as k3s.yaml inside the backup folder you downloaded earlier.
Cluster configuration
To restore the Kubernetes cluster, execute the .\restore-helm.ps1 script with
the following parameters:
Execute the .\restore-timescale.ps1 and .\restore-timescale-v2.ps1 script with the
following parameters to restore factoryinsight and umh_v2 databases:
Unable to connect to the server: x509: certificate signed …
This issue may occur when the device’s IP address changes from DHCP to static
after installation. A quick solution is skipping TLS validation. If you want
to enable insecure-skip-tls-verify option, run the following command on
the instance’s shell before copying kubeconfig on the server:
This page describes how to backup and restore the database.
Before you begin
For this task, you need to have PostgreSQL
installed on your machine. Make sure that its version is compatible with the version
installed on the UMH.
Also, enough free space is required on your machine to store the backup. To check
the size of the database, ssh into the system and follow the steps below:
If you want to backup the Grafana or umh_v2 database, you can follow the same steps
as above, but you need to replace any occurence of factoryinsight with grafana.
In addition, you need to write down the credentials in the
grafana-secret Secret, as they are necessary
to access the dashboard after restoring the database.
The default username for umh_v2 database is kafkatopostgresqlv2, and the password is
changemetoo.
Restoring the database
For this section, we assume that you are restoring the data to a fresh United
Manufacturing Hub installation with an empty database.
Temporarly disable kafkatopostrgesql, kafkatopostgresqlv2, and factoryinsight
Since kafkatopostrgesql, kafkatopostgresqlv2, and factoryinsight microservices
might write actual data into the database while restoring it, they should be
disabled. Connect to your server via SSH and run the following command:
This section shows an example for restoring factoryinsight. If you want to restore
grafana, you need to replace any occurence of factoryinsight with grafana.
For umh_v2, you should use kafkatopostgresqlv2 for the user name and
changemetoo for the password.
Make sure that your device is connected to server via SSH and run the following command:
This page describes how to import and export Node-RED flows.
Export Node-RED Flows
To export Node-RED flows, please follow the steps below:
Access Node-RED by navigating to http://<CLUSTER-IP>:1880/nodered in your
browser. Replace <CLUSTER-IP> with the IP address of your cluster, or
localhost if you are running the cluster locally.
From the top-right menu, select Export.
From the Export dialog, select wich nodes or flows you want to export.
Click Download to download the exported flows, or Copy to clipboard to
copy the exported flows to the clipboard.
The credentials of the connector nodes are not exported. You will need to
re-enter them after importing the flows.
Import Node-RED Flows
To import Node-RED flows, please follow the steps below:
Access Node-RED by navigating to http://<CLUSTER-IP>:1880/nodered in your
browser. Replace <CLUSTER-IP> with the IP address of your cluster, or
localhost if you are running the cluster locally.
From the top-right menu, select Import.
From the Import dialog, select the file containing the exported flows, or
paste the exported flows from the clipboard.
Click Import to import the flows.
7.5 - Security
This section contains information about how to secure the United Manufacturing
Hub.
7.5.1 - Enable RBAC for the MQTT Broker
This page describes how to enable Role-Based Access Control (RBAC) for the
MQTT broker.
Enable RBAC
Enable RBAC by upgrading the value in the Helm chart.
Replace <version> with the version of the HiveMQ CE extension. If you are
not sure which version is installed, you can press Tab after typing
java -jar hivemq-file-rbac-extension- to autocomplete the version.
Replace <password> with your desired password. Do not use any whitespaces.
Copy the output of the command. It should look similar to this:
This command will open the default text editor with the ConfigMap contents.
Change the value inbetween the <password> tags with the password hash
generated in step 4.
You can use a different password for each different microservice. Just
remember that you will need to update the configuration in each one
to use the new password.
Save the changes.
Recreate the Pod:
sudo $(which kubectl) delete pod united-manufacturing-hub-hivemqce-0 -n united-manufacturing-hub --kubeconfig /etc/rancher/k3s/k3s.yaml
This page describes how to setup firewall rules for the UMH instances.
Some enterprise networks operate in a whitelist manner, where all outgoing and incoming communication
is blocked by default. However, the installation and maintenance of UMH requires internet access for
tasks such as downloading the operating system, Docker containers, monitoring via the Management Console,
and loading third-party plugins. As dependencies are hosted on various servers and may change based on
vendors’ decisions, we’ve simplified the user experience by consolidating all mandatory services under a
single domain. Nevertheless, if you wish to install third-party components like Node-RED or Grafana plugins,
you’ll need to whitelist additional domains.
Before you begin
The only prerequisite is having a firewall that allows modification of rules. If you’re unsure about this,
consider contacting your network administrator.
Firewall Configuration
Once you’re ready and ensured that you have the necessary permissions to configure the firewall, follow these steps:
Whitelist management.umh.app
This mandatory step requires whitelisting management.umh.app on TCP port 443 (HTTPS traffic). Not doing so will
disrupt UMH functionality; installations, updates, and monitoring won’t work as expected.
Optional: Whitelist domains for common 3rd party plugins
Include these common external domains and ports in your firewall rules to allow installing Node-RED and Grafana plugins:
registry.npmjs.org (required for installing Node-RED plugins)
storage.googleapis.com (required for installing Grafana plugins)
grafana.com (required for displaying Grafana plugins)
catalogue.nodered.org (required for displaying Node-RED plugins, only relevant for the client that is using Node-RED, not
the server where it’s installed on).
Depending on your setup, additional domains may need to be whitelisted.
DNS Configuration (Optional)
By default, we are using your DHCP configured DNS servers. If you are using static ip or want to use a different DNS server,
contact us for a custom configuration file.
Bring your own containers
Our system tries to fetch all containers from our own registry (management.umh.app) first.
If this fails, it will try to fetch docker.io from https://registry-1.docker.io, ghcr.io from https://ghcr.io and quay.io from https://quay.io (and any other from management.umh.app)
If you need to use a different registry, edit the /var/lib/rancher/k3s/agent/etc/containerd/config.toml.tmpl to set your own mirror configuration.
Troubleshooting
I’m having connectivity problems. What should I do?
First of all, double-check that your firewall rules are configured as described in this page, especially the step
involving our domain. As a quick test, you can use the following command from a different machine within the same
network to check if the rules are working:
curl -vvv https://management.umh.app
7.5.3 - Setup PKI for the MQTT Broker
This page describes how to setup the Public Key Infrastructure (PKI) for the
MQTT broker.
If you want to use MQTT over TLS (MQTTS) or Secure Web Socket (WSS) you need
to setup a Public Key Infrastructure (PKI).
The Public Key Infrastructure for HiveMQ consists of two Java Key Stores (JKS):
Keystore: The Keystore contains the HiveMQ certificate and private keys.
This store must be confidential, since anyone with access to it could generate
valid client certificates and read or send messages in your MQTT infrastructure.
Truststore: The Truststore contains all the clients public certificates.
HiveMQ uses it to verify the authenticity of the connections.
Before you begin
You need to have the following tools installed:
OpenSSL. If you are using Windows, you can install it with
Chocolatey.
<password>: The password for the keystore. You can use any password you want.
<days>: The number of days the certificate should be valid.
The command runs for a few minutes and generates a file named hivemq.jks in
the current directory, which contains the HiveMQ certificate and private key.
If you want to explore the contents of the keystore, you can use
Keystore Explorer.
Generate client certificates
Open a terminal and create a directory for the client certificates:
mkdir pki
Follow these steps for each client you want to generate a certificate for.
You could also do it manually with the following command:
openssl base64 -A -in <filename> -out <filename>.b64
Now you can import the PKI into the United Manufacturing Hub. To do so, create
a file named pki.yaml with the following content:
_000_commonConfig:infrastructure:mqtt:tls:keystoreBase64:<content of hivemq.jks.b64>keystorePassword:<password>truststoreBase64:<content of hivemq-trust-store.jks.b64>truststorePassword:<password><servicename>.cert:<content of <servicename>-cert.pem.b64><servicename>.key:<content of <servicename>-key.pem.b64>
Now, send copy it to your instance with the following command:
scp pki.yaml <username>@<ip-address>:/tmp
After that, access the instance with SSH and run the following command:
This section contains information about the new features and changes in the
United Manufacturing Hub.
All new features, changes, deprecations, and breaking changes in the United Manufacturing Hub are now documented in our Discord channel.
Join our community to stay up to date with the latest developments!
8.1 - Archive
This section is meant to archive the “What’s new” pages only related to the
United Manufacturing Hub’s Helm chart.
8.1.1 - What's New in Version 0.9.15
This section contains information about the new features and changes in the
United Manufacturing Hub introduced in version 0.9.15.
Welcome to United Manufacturing Hub version 0.9.15! In this release we added
support for the UNS
data model, by introducing a new microservice, Data Bridge.
For a complete list of changes, refer to the
release notes.
Data Bridge
Data-bridge is a microservice
specifically tailored to adhere to the
UNS
data model. It consumes topics from a message broker, translates them to
the proper format and publishes them to the other message broker.
It can consume from and publish to both Kafka and MQTT brokers, whether they are
local or remote.
It’s main purpose is to merge messages from multiple topics into a single topic,
using the message key to identify the source topic.
This section contains information about the new features and changes in the
United Manufacturing Hub introduced in version 0.9.14.
Welcome to United Manufacturing Hub version 0.9.14! In this release we changed
the Kafka broker from Apache Kafka to RedPanda, which is a Kafka-compatible
event streaming platform. We also started migrating to a different kafka
library in our micoservices, which will allow full ARM support in the future.
Finally, we tweaked the overall resource usage of the United Manufacturing Hub
to improve performance and efficiency, along with some bug fixes.
For a complete list of changes, refer to the
release notes.
RedPanda
RedPanda is a Kafka-compatible event streaming
platform. It is built with modern hardware in mind and utilizes multi-core CPUs
efficiently, which can result in better performance compared to Kafka. RedPanda
also offers lower latency and higher throughput, making it a better fit for
real-time use cases in IIoT applications. Additionally, RedPanda has a simpler
setup and management process compared to Kafka, which can save time and
resources for development teams. Finally, RedPanda is fully compatible with
Kafka’s API, allowing for a seamless transition for existing Kafka users.
Overall, Redpanda can provide improved performance and efficiency for IIoT
applications that require real-time data processing and management with a lower
setup and management cost.
Sarama Kafka Library
We started migrating our microservices to use the
Sarama Kafka library. This library is
written in Go and is fully compatible with RedPanda. This change will allow us
to support ARM-based devices in the future, which will be useful for edge
computing use cases. Addedd bonus is that Sarama is faster and requires less
memory than the previous library.
For now we only migrated the following microservices:
barcodereader
kafka-init (used as an init container for components that communicate with
Kafka)
mqtt-kafka-bridge
Resources tweaking
With this release we tweaked the resource requests of each default component
of the United Manufacturing Hub to respect the minimum requirements of 4 cores
and 8GB of RAM. This allowed us to increase the memory allocated for the MQTT
broker, resulting in solving the common Out Of Memory issue that caused the
broker to restart.
Be sure to follow the upgrade guide
to adjust your resources accordingly.
The following table shows the new resource requests and limits when deploying
the United Manufacturing Hub with the default configuration or with all the
components enabled. CPU values are expressed in millicores and memory values
are expressed in mebibytes.
resources
Resource
Requests
Limits
CPU (default values)
1080m (27%)
1890m (47%)
Memory (default values)
1650Mi (21%)
2770Mi (35%)
CPU (all components)
2002m (50%)
2730m (68%)
Memory (all components)
2873Mi (36%)
3578Mi (45%)
The requested resources are the ones immediately allocated to the container
when it starts, and the limits are the maximum amount of resources that the
container can (but is not forced to) use. For more information about Kubernetes
resources, refer to the
official documentation.
Container registry
We moved our container registry from Docker Hub to GitHub Container Registry.
This change won’t affect the way you deploy the United Manufacturing Hub, but
it will allow us to better manage our container images and provide a better
experience for our developers. For the time being, we will continue to publish
our images to Docker Hub, but we will eventually deprecate the old registry.
Others
Implemented a new test build to detect race conditions in the codebase. This
will help us to improve the stability of the United Manufacturing Hub.
All our custom images now run as non-root by default, except for the ones that
require root privileges.
The custom microservices now allow to change the type of Service used to
expose them by setting serviceType field.
Added an SQL trigger function that deletes duplicate records from the
statetable table after insertion.
Enhanced the environment variables validation in the codebase.
Added possibility to set the aggregation interval when calculating the
throughput of an asset.
Various dependencies has been updated to their latest version.
8.1.3 - What's New in Version 0.9.13
This section contains information about the new features and changes in the
United Manufacturing Hub introduced in version 0.9.13.
Welcome to United Manufacturing Hub version 0.9.13! This is a minor release that
only updates the new metrics feature.
For a complete list of changes, refer to the
release notes.
8.1.4 - What's New in Version 0.9.12
This section contains information about the new features and changes in the
United Manufacturing Hub introduced in version 0.9.12.
Welcome to United Manufacturing Hub version 0.9.12! Read on to learn about
the new features of the UMH Datasource V2 plugin for Grafana, Redis running
in standalone mode, and more.
For a complete list of changes, refer to the
release notes.
Grafana
New Grafana version
Grafana has been upgraded to version 9.4.3. This introduces new search and
navigation features, a redesigned details section of the logs, and a new
data source connection page.
We have upgraded Node-RED to version 3.0.2.
Checkout the Node-RED release notes for more information.
UMH Datasource V2 plugin
The latest update to the datasource has incorporated typesafe JSON parsing,
significantly enhancing the overall performance and dependability of the plugin.
This implementation ensures that the parsing process strictly adheres to predefined
data types, eliminating the possibility of unexpected errors or data corruption
that can occur with loosely-typed JSON parsing.
Redis in standalone mode
Redis, the service used for caching, is now deployed in standalone mode. This
change introduces these benefits:
Simplicity: Running Redis in standalone mode is simpler than using a
master-replica topology with Sentinel. With standalone mode, there is only one
Redis instance to manage, whereas with master-replica, you need to manage
multiple Redis instances and the Sentinel process. This simplicity can reduce
complexity and make it easier to manage Redis instances.
Lower Overhead: Standalone mode has lower overhead than using a master-replica
topology with Sentinel. In a master-replica topology, there is a communication
overhead between the master and the replicas, and Sentinel adds additional
overhead for monitoring and failover management. In contrast, standalone mode
does not have this overhead.
Better Performance: Since standalone mode does not have the overhead of
master-replica topology with Sentinel, it can provide better performance.
Standalone mode provides faster response times and can handle more requests
per second than a master-replica topology with Sentinel.
That being said, it’s important to note that a master-replica topology with
Sentinel provides higher availability and failover capabilities than standalone
mode.
All basic services are now exposed by a LoadBalancer Service
The MQTT Broker, Kafka Broker, and Kafka Console are now exposed by a
LoadBalancer Service, along with the Database, Grafana and Node-RED. This
change makes it easier to access these services from outside the cluster, as
they are now accessible via the IP address of the cluster.
When installing the United Manufacturing Hub locally, the cluster ports are
automatically mapped to the host ports. This means that you can access the
services from your browser by using localhost and the port number.
Read more about connecting to the services from outside the cluster in the
related documentation.
Metrics
We introduced an optional microservice that can be used to collect metrics
about the system, like OS, CPU, memory, hostname and average load. These metrics
are then sent to our server for analysis, and are completely anonymous. This
microservice is enabled by default, but can be disabled by setting the
_000_commonConfig.metrics.enabled value to false in the values.yaml file.
We replaced confluent kafka with Sarama in the MQTT-Kafka Bridge.
This increased the performance & stability and is a first step towards ARM compatibility.
Automated testing
We have added automated end-to-end testing to the United Manufacturing Hub. This
includes testing the installation and the upgrading of the United Manufacturing Hub,
as well as testing the functionality of the microservices.
Deprecations
Cameraconnect
The Cameraconnect microservice has been deprecated and removed from the
United Manufacturing Hub. It’s development has been taken over by Anticipate.
Blob storage
The blob storage service has been deprecated and removed from the United
Manufacturing Hub. This includes the MinIO Operator and Tenant, and the MQTT to
Blob microservice.
Fixes
Many fixes have been made to the United Manufacturing Hub, including known
issues for Sensorconnect and MQTT Bridge.
8.1.5 - What's New in Version 0.9.11
This section contains information about the new features and changes in the
United Manufacturing Hub introduced in version 0.9.11.
Welcome to United Manufacturing Hub version 0.9.11! This patch introduces only
minor bugfixes for Factoryinput and Sensorconnect.
For a complete list of changes, refer to the
release notes.
8.1.6 - What's New in Version 0.9.10
This section contains information about the new features and changes in the
United Manufacturing Hub introduced in version 0.9.10.
Welcome to United Manufacturing Hub version 0.9.10! In this release, we have
changed the MQTT broker to HiveMQ and the Kafka console to RedPanda Console.
A new OPC UA server simulator has been added, along with a new API service to
connect to Factoryinsight from outside the cluster, especially tailored for
usage with Tulip. Grafana now comes with presinstalled plugins and datasources,
and the UMH datasource V2 supports grouping of custom tags.
For a complete list of changes, refer to the
release notes.
MQTT Broker
The MQTT broker has been changed from VerneMQ to HiveMQ. This change won’t
affect the end user, but it will allow us to better maintain the MQTT broker
in the future.
The Kowl project as been acquired by RedPanda and is now called RedPanda
Console. The functionalities are mostly the same.
OPC UA Server Simulator
A new data simulator for OPC UA has been added. It is based on the
OPC/UA
simulator by Amine, and it allows you to
simulate OPC UA servers in order to test the United Manufacturing Hub.
Grafana
Default plugins
Grafana now comes with the following plugins preinstalled:
ACE.SVG by Andrew Rodgers
Button Panel by UMH Systems Gmbh
Button Panel by CloudSpout LLC
Discrete by Natel Energy
Dynamic Text by Marcus Olsson
FlowCharting by agent
Pareto Chart by isaozler
Pie Chart (old) by Grafana Labs
Timepicker Buttons Panel by williamvenner
UMH Datasource by UMH Systems Gmbh
UMH Datasource V2 by UMH Systems Gmbh
Untimely by factry
Worldmap Panel by Grafana Labs
Grouping of custom tags
The UMH datasource V2 now supports grouping of custom tags. This allows you to
group processValues by a common prefix, and then use the group name as a variable
in Grafana.
Tulip connector
A new API service has been added to connect to Factoryinsight from outside the
cluster. This service is especially tailored for usage with Tulip,
and it allows you to connect to Factoryinsight from outside the cluster.
This section contains information about the new features and changes in the
United Manufacturing Hub introduced in version 0.9.9.
Welcome to United Manufacturing Hub version 0.9.9! This version introduces
the PackML-MQTT-Simulator, to
simulate a PackML state machine and publish the state changes to MQTT. It also
includes new liveness probes for some of the Pods and minor fixes.
For a complete list of changes, refer to the
release notes.
PackML-MQTT-Simulator
The PackML-MQTT-Simulator is
is a virtual line that interfaces using PackML implemented over MQTT. It allows
you to simulate a PackML state machine and publish the state changes to MQTT.
8.1.8 - What's New in Version 0.9.8
This section contains information about the new features and changes in the
United Manufacturing Hub introduced in version 0.9.8.
Welcome to United Manufacturing Hub version 0.9.8! Read on to learn about the
new Factoryinsight API V2 and the related datasource plugin for Grafana with
support for historian functionalities.
For a complete list of changes, refer to the
release notes.
Historian functionalities
The new v2 API of Factoryinsight now supports historian functionalities. This
means that you can now query the history of your data and visualize it in
Grafana. The new datasource plugin for Grafana supports the Time Bucket
Aggregation, which allows you to aggregate your data by values like the average,
minimum or maximum.
8.1.9 - What's New in Version 0.2
This section contains information about the new features and changes in the
United Manufacturing Hub introduced in version 0.2.
Welcome to United Manufacturing Hub version 0.2!
It this release we have some exiting changes to the Management Console!
0.2.0
Management Console
The Data Connections and Data Sources administration has been revised, and now
it’s all in one place called Connection Management. This new concept revolves
around the idea of a connection, which is just a link between your UMH instance
and a data source. You can then configure the connection to fetch data from the
source, and monitor its status. Additionally, you can now edit existing connections
and data source configurations, and delete them if you don’t need them anymore.
0.2.2
Management Console
The updating functionality has been temporarily disabled, as it gives errors
even when the update is successful. We are working on a fix for this issue and
will re-enable the functionality as soon as possible.
0.2.3
Centralized all initial installation and continuous updating processes (Docker, k3s, helm, flatcar, …) to interact solely with management.umh.app. This ensures that only one domain is necessary to be allowed in the firewall for these activities.
Data Infrastructure
Upgraded the Helm Chart to version 0.10.6, which includes:
Transitioned Docker URLs to our internal registry from a single domain (see above)
Removed obsolete services: factoryinput, grafanaproxy, custom microservice tester, kafka-state-detector, mqtt-bridge. This change is also reflected in our documentation.
Resolved an issue where restarting kafka-to-postgres was necessary when adding a new topic.
Device & Container Infrastructure
Modified flatcar provisioning and the installation script to retrieve all necessary binaries from a single domain (see above)
Management Console
Addressed a bug that prevented the workspace tab from functioning correctly in the absence of configured connections.
0.2.4
Management Console
Addressed multiple bugs in the updater functionality, preventing the frontend from registering a completed update.
0.2.5
Management Console
Addressed multiple bugs in the updater functionality, preventing the frontend from registering a completed update.
0.2.6
Management Console
Fixed crash on connection loss.
Structures for the new data model are now in place.
0.2.7
Management Console
Added companion functionality to generate and send v2 formatted tags.
Added frontend functionality to retrieve v2 formatted tags.
0.2.8
Management Console
Re-enabled the updating functionality, which is now working as expected. You will need to manually update
your instances’ Management Companion to the latest version to ensure compatibility.
To do so, from you UMH instance, run the following command:
Now supports connecting to Prosys OPC UA server, Microsoft OPC UA simulator (encrypted) & S7 via OPC UA.
Added encryption level auto discovery (This will attempt to connect with the highest encryption level first, and then step down if necessary).
0.2.18
Management Console
Added the capability to monitor the uptime (Device, UMH, Companion).
Fixed tag browser not showing all datapoints, when rate was greater than 1Hz..
Increased stability of the companion.
Improved handling on connection loss while downloading dependencies.
More stability when a user has a lot of instances.
Unified webui layout.
Improved error handling inside the UNS tree.
Improved UI when having many instances.
Fixed rendering of special characters in the tag browser.
Improved frontend performance.
Improved data issue highlighting in the tag browser.
Added option to delete instances.
Reduced error banner spam.
Added UMH Lite support.
Improved UI behavior when management console is offline.
Many minor bug fixes and improvements.
0.2.19
Management Console
Resolved Tag Display Issue: Fixed a bug that caused erratic movement of tags within the tag browser.
Enhanced Latency Measurements: Added latency measurements for communication from the frontend to the backend and from the companion to the backend.
Infrastructure Improvements and Reliability Enhancements: Enhanced infrastructure reliability by addressing failures related to fetching k3s, Docker images, and other critical components. Introduced a retry mechanism wherever possible.
Benthos-UMH Upgrade: Upgraded the benthos-umh version to improve reconnection logic in specific edge cases and enable the use of the metadata s7_address.
OPC UA Authentication Update: Enabled passwordless authentication for OPC UA under configurable security settings.
0.2.20
Management Console
Resolved an issue where an unpublished feature was visible in the UI and made the protocol converter not work as expected
0.2.21
Management Console
Resolved multiple bugs with upcoming features
0.2.22
Management Console
Resolved multiple bugs with upcoming features
0.2.23
Management Console
Various bug fixes for the protocol converter
Enabled protocol converter in lite mode
Enabled lite mode
Preparation for enhanced tag browser
8.1.10 - What's New in Version 0.1
This section contains information about the new features and changes in the
United Manufacturing Hub introduced in version 0.1.
Welcome to United Manufacturing Hub version 0.1! This marks the first release of
the United Manufacturing Hub, even though it’s been available for a while now.
You might have already seen other versions (probably the ones in the archive),
but those were only referring to the UMH Helm chart. This new versioning is meant
to include the entire United Manufacturing Hub, as defined in the architecture.
So from now on, the United Manufacturing Hub will be versioned as a whole, and
will include the Management Console, the Data Infrastructure, and the Device &
Container Infrastructure, along with all the other bits and pieces that make up
the United Manufacturing Hub.
0.1.0
Data Infrastructure
The Helm chart version has been updated to 0.9.34. This marks one of the final steps
towards the full integration of the new data model. It is
now possible to format the data into the ISA95 standard, send it through the
Unified Namespace, and store it in the Historian.
Management Console
There are many features already available in the Management Console, so we’ll
only list the most important ones here.
Provision the Data Infrastructure
Configure and manage connections and data sources
Visualize the Unified Namespace and the data flow
Upgrade the Management Companion directly from the Management Console. You will
first need to
manually upgrade
it to this version, and then for all the future versions you will be able to do
it directly from the Management Console.
Benthos-UMH
Connect OPC-UA servers to the United Manufacturing Hub
Configure how each node will send data to the Unified Namespace
9 - Reference
This section of the United Manufacturing Hub documentation contains
references.
9.1 - Helm Chart
This page describes the Helm Chart of the United Manufacturing Hub and the
possible configuration options.
An Helm chart is a package manager for Kubernetes that simplifies the
installation, configuration, and deployment of applications and services.
It contains all the necessary Kubernetes manifests, configuration files, and
dependencies required to run a particular application or service. One of the
main advantages of Helm is that it allows to define the configuration of the
installed resources in a single YAML file, called values.yaml. Helm provides
great documentation
on this process.
The Helm Chart of the United Manufacturing Hub is composed of both custom
microservices and third-party applications. If you want a more in-depth view of
the architecture of the United Manufacturing Hub, you can read the Architecture overview page.
Helm Chart structure
Custom microservices
The Helm Chart of the United Manufacturing Hub is composed of the following
custom microservices:
barcodereader: reads the input from
a barcode reader and sends it to the MQTT broker for further processing.
customMicroservice: a
template for deploying any number of custom microservices.
data-bridge: transfers data between two
Kafka or MQTT brokers, transforming the data following the UNS data model.
factoryinsight: provides REST
endpoints to fetch data and calculate KPIs.
MQTT Simulator: simulates
sensors and sends the data to the MQTT broker for further processing.
kafka-bridge: connects Kafka brokers
on different Kubernetes clusters.
kafkatopostgresql:
stores the data from the Kafka broker in a PostgreSQL database.
TimescaleDB: an open-source time-series SQL
database.
Configuration options
The Helm Chart of the United Manufacturing Hub can be configured by setting
values in the values.yaml file. This file has three main sections that can be
used to configure the applications:
customers: contains the definition of the customers that will be created
during the installation of the Helm Chart. This section is optional, and it’s
used only by factoryinsight.
_000_commonConfig: contains the basic configuration options to customize the
United Manufacturing Hub, and it’s divided into sections that group applications
with similar scope, like the ones that compose the infrastructure or the ones
responsible for data processing. This is the section that should be mostly used
to configure the microservices.
_001_customMicroservices: used to define the configuration of
custom microservices that are not included in the Helm Chart.
After those three sections, there are the specific sections for each microservice,
which contain their advanced configuration. This is the so called Danger Zone,
because the values in those sections should not be changed, unlsess you absolutely
know what you are doing.
When a parameter contains . (dot) characters, it means that it is a nested
parameter. For example, in the tls.factoryinsight.cert parameter the cert
parameter is nested inside the tls.factoryinsight section, and the factoryinsight
section is nested inside the tls section.
Customers
The customers section contains the definition of the customers that will be
created during the installation of the Helm Chart. It’s a simple dictionary where
the key is the name of the customer, and the value is the password.
For example, the following snippet creates two customers:
customers:customer1:password1customer2:password2
Common configuration options
The _000_commonConfig contains the basic configuration options to customize the
United Manufacturing Hub, and it’s divided into sections that group applications
with similar scope.
The following table lists the configuration options that can be set in the
_000_commonConfig section:
_000_commonConfig section parameters
Parameter
Description
Type
Allowed values
Default
datainput
The configuration of the microservices used to input data.
The name of the database to use for the data model v2
string
Any
umh_v2
database.host
The host of the database to use for the data model v2
string
Any
united-manufacturing-hub
grafana.dbreader
The name of the Grafana read-only database user
string
Any
grafanareader
grafana.dbpassword
The password of the Grafana read-only database user
string
Any
changeme
Bridges
The _000_commonConfig.datamodel_v2.bridges section contains a list of configuration
options for the data bridge.
Each item in the list represents a data bridge instance, and the following table
lists the configuration options that can be set in each item:
bridges section parameters
Parameter
Description
Type
Allowed values
Default
mode
The mode of the data bridge.
string
mqtt-kafka, kafka-kafka, mqtt-mqtt
mqtt-kafka
brokerA
The address of the source broker. Can be either MQTT or Kafka, and must include the port
string
Valid address
united-manufacturing-hub-mqtt:1883
brokerB
The address of the destination broker. Can be either MQTT or Kafka, and must include the port
string
Valid address
united-manufacturing-hub-kafka:9092
topic
The topic to subscribe to. Can be in either MQTT or Kafka form. Wildcards (# for MQTT, .* for Kafka) are allowed in order to subscribe to multiple topics
string
Any
umh.v1..*
topicMergePoint
The nth part of the topic to use as the message key. If the topic is umh/v1/acme/anytown/foo/bar/#, and this value is 5, then all the messages wil end up in the topic umh.v1.acme.anytown.foo
int
Greater than 3
5
partitions
The number of partitions to use for the destination topic. Only used if the destination broker is Kafka.
int
Greater than 0
6
replicationFactor
The replication factor to use for the destination topic. Only used if the destination broker is Kafka.
int
Odd integer
1
mqttEnableTLS
Whether to enable TLS for the MQTT connection. Only used with MQTT brokers
bool
true, false
false
mqttPassword
The password to use for the MQTT connection. Only used with MQTT brokers
string
Any
""
messageLRUSize
The size of the LRU cache used to avoid message looping. Only used with MQTT brokers
int
Any
1000000
Data sources
The _000_commonConfig.datasources section contains the configuration of the
microservices used to acquire data, like the ones that connect to a sensor or
simulate data.
The following table lists the configuration options that can be set in the
_000_commonConfig.datasources section:
datasources section parameters
Parameter
Description
Type
Allowed values
Default
barcodereader
The configuration of the barcodereader microservice.
The _000_commonConfig.dataprocessing.nodered section contains the configuration
of the nodered microservice.
The following table lists the configuration options that can be set in the
_000_commonConfig.dataprocessing.nodered section:
nodered section parameters
Parameter
Description
Type
Allowed values
Default
enabled
Whether the nodered microservice is enabled.
bool
true, false
true
defaultFlows
Whether the default flows should be used.
bool
true, false
false
Infrastructure
The _000_commonConfig.infrastructure section contains the configuration of the
microservices responsible for connecting all the other microservices, such as the
MQTT broker and the
Kafka broker.
The following table lists the configuration options that can be set in the
_000_commonConfig.infrastructure section:
The private key of the certificate for the Kafka broker
string
Any
—–BEGIN PRIVATE KEY—– … —–END PRIVATE KEY—–
tls.barcodereader.sslKeyPassword
The encrypted password of the SSL key for the barcodereader microservice. If empty, no password is used
string
Any
""
tls.barcodereader.sslKeyPem
The private key for the SSL certificate of the barcodereader microservice
string
Any
—–BEGIN PRIVATE KEY—– … —–END PRIVATE KEY—–
tls.barcodereader.sslCertificatePem
The private SSL certificate for the barcodereader microservice
string
Any
—–BEGIN CERTIFICATE—– … —–END CERTIFICATE—–
tls.kafkabridge.sslKeyPasswordLocal
The encrypted password of the SSL key for the local kafkabridge broker. If empty, no password is used
string
Any
""
tls.kafkabridge.sslKeyPemLocal
The private key for the SSL certificate of the local kafkabridge broker
string
Any
—–BEGIN PRIVATE KEY—– … —–END PRIVATE KEY—–
tls.kafkabridge.sslCertificatePemLocal
The private SSL certificate for the local kafkabridge broker
string
Any
—–BEGIN CERTIFICATE—– … —–END CERTIFICATE—–
tls.kafkabridge.sslCACertRemote
The CA certificate for the remote kafkabridge broker
string
Any
—–BEGIN CERTIFICATE—– … —–END CERTIFICATE—–
tls.kafkabridge.sslCertificatePemRemote
The private SSL certificate for the remote kafkabridge broker
string
Any
—–BEGIN CERTIFICATE—– … —–END CERTIFICATE—–
tls.kafkabridge.sslKeyPasswordRemote
The encrypted password of the SSL key for the remote kafkabridge broker. If empty, no password is used
string
Any
""
tls.kafkabridge.sslKeyPemRemote
The private key for the SSL certificate of the remote kafkabridge broker
string
Any
—–BEGIN PRIVATE KEY—– … —–END PRIVATE KEY—–
tls.kafkadebug.sslKeyPassword
The encrypted password of the SSL key for the kafkadebug microservice. If empty, no password is used
string
Any
""
tls.kafkadebug.sslKeyPem
The private key for the SSL certificate of the kafkadebug microservice
string
Any
—–BEGIN PRIVATE KEY—– … —–END PRIVATE KEY—–
tls.kafkadebug.sslCertificatePem
The private SSL certificate for the kafkadebug microservice
string
Any
—–BEGIN CERTIFICATE—– … —–END CERTIFICATE—–
tls.kafkainit.sslKeyPassword
The encrypted password of the SSL key for the kafkainit microservice. If empty, no password is used
string
Any
""
tls.kafkainit.sslKeyPem
The private key for the SSL certificate of the kafkainit microservice
string
Any
—–BEGIN PRIVATE KEY—– … —–END PRIVATE KEY—–
tls.kafkainit.sslCertificatePem
The private SSL certificate for the kafkainit microservice
string
Any
—–BEGIN CERTIFICATE—– … —–END CERTIFICATE—–
tls.kafkatopostgresql.sslKeyPassword
The encrypted password of the SSL key for the kafkatopostgresql microservice. If empty, no password is used
string
Any
""
tls.kafkatopostgresql.sslKeyPem
The private key for the SSL certificate of the kafkatopostgresql microservice
string
Any
—–BEGIN PRIVATE KEY—– … —–END PRIVATE KEY—–
tls.kafkatopostgresql.sslCertificatePem
The private SSL certificate for the kafkatopostgresql microservice
string
Any
—–BEGIN CERTIFICATE—– … —–END CERTIFICATE—–
tls.kowl.sslKeyPassword
The encrypted password of the SSL key for the kowl microservice. If empty, no password is used
string
Any
""
tls.kowl.sslKeyPem
The private key for the SSL certificate of the kowl microservice
string
Any
—–BEGIN PRIVATE KEY—– … —–END PRIVATE KEY—–
tls.kowl.sslCertificatePem
The private SSL certificate for the kowl microservice
string
Any
—–BEGIN CERTIFICATE—– … —–END CERTIFICATE—–
tls.mqttkafkabridge.sslKeyPassword
The encrypted password of the SSL key for the mqttkafkabridge microservice. If empty, no password is used
string
Any
""
tls.mqttkafkabridge.sslKeyPem
The private key for the SSL certificate of the mqttkafkabridge microservice
string
Any
—–BEGIN PRIVATE KEY—– … —–END PRIVATE KEY—–
tls.mqttkafkabridge.sslCertificatePem
The private SSL certificate for the mqttkafkabridge microservice
string
Any
—–BEGIN CERTIFICATE—– … —–END CERTIFICATE—–
tls.nodered.sslKeyPassword
The encrypted password of the SSL key for the nodered microservice. If empty, no password is used
string
Any
""
tls.nodered.sslKeyPem
The private key for the SSL certificate of the nodered microservice
string
Any
—–BEGIN PRIVATE KEY—– … —–END PRIVATE KEY—–
tls.nodered.sslCertificatePem
The private SSL certificate for the nodered microservice
string
Any
—–BEGIN CERTIFICATE—– … —–END CERTIFICATE—–
tls.sensorconnect.sslKeyPassword
The encrypted password of the SSL key for the sensorconnect microservice. If empty, no password is used
string
Any
""
tls.sensorconnect.sslKeyPem
The private key for the SSL certificate of the sensorconnect microservice
string
Any
—–BEGIN PRIVATE KEY—– … —–END PRIVATE KEY—–
tls.sensorconnect.sslCertificatePem
The private SSL certificate for the sensorconnect microservice
string
Any
—–BEGIN CERTIFICATE—– … —–END CERTIFICATE—–
Data storage
The _000_commonConfig.datastorage section contains the configuration of the
microservices used to store data. Specifically, it controls the following
microservices:
If you want to specifically configure one of these microservices, you can do so
in their respective sections in the Danger Zone.
The following table lists the configurable parameters of the
_000_commonConfig.datastorage section.
datastorage section parameters
Parameter
Description
Type
Allowed values
Default
enabled
Whether to enable the data storage microservices
bool
true, false
true
db_password
The password for the database. Used by all the microservices that need to connect to the database
string
Any
changeme
Kafka Bridge
The _000_commonConfig.kafkaBridge section contains the configuration of the
kafka-bridge microservice,
responsible for bridging Kafka brokers in different Kubernetes clusters.
The following table lists the configurable parameters of the
_000_commonConfig.kafkaBridge section.
The _000_commonConfig.debug section contains the debug configuration for all
the microservices. This values should not be enabled in production.
The following table lists the configurable parameters of the
_000_commonConfig.debug section.
debug section parameters
Parameter
Description
Type
Allowed values
Default
enableFGTrace
Whether to enable the foreground trace
bool
true, false
false
Tulip Connector
The _000_commonConfig.tulipconnector section contains the configuration of
the tulip-connector
microservice, responsible for connecting a Tulip instance with the United
Manufacturing Hub.
The following table lists the configurable parameters of the
_000_commonConfig.tulipconnector section.
tulipconnector section parameters
Parameter
Description
Type
Allowed values
Default
enabled
Whether to enable the tulip-connector microservice
bool
true, false
false
domain
The domain name pointing to you cluster
string
Any valid domain name
tulip-connector.changme.com
Custom microservices configuration
The _001_customConfig section contains a list of custom microservices
definitions. It can be used to deploy any application of your choice, which can
be configured using the following parameters:
Custom microservices configuration parameters
Parameter
Description
Type
Allowed values
Default
name
The name of the microservice
string
Any
example
image
The image and tag of the microservice
string
Any
hello-world:latest
enabled
Whether to enable the microservice
bool
true, false
false
imagePullPolicy
The image pull policy of the microservice
string
“Always”, “IfNotPresent”, “Never”
“Always”
env
The list of environment variables to set for the microservice
object
Any
[{name: LOGGING_LEVEL, value: PRODUCTION}]
port
The internal port of the microservice to target
int
Any
80
externalPort
The host port to which expose the internal port
int
Any
8080
probePort
The port to use for the liveness and startup probes
int
Any
9091
startupProbe
The interval in seconds for the startup probe
int
Any
200
livenessProbe
The interval in seconds for the liveness probe
int
Any
500
statefulEnabled
Create a PersistentVolumeClaim for the microservice and mount it in /data
bool
true, false
false
Danger zone
The next sections contain a more advanced configuration of the microservices.
Usually, changing the values of the previous sections is enough to run the
United Manufacturing Hub. However, you may need to adjust some of the values
below if you want to change the default behavior of the microservices.
Everything below this point should not be changed, unless you know what you are doing.
Whether to enable the initChownData job, to reset data ownership at startup
bool
true, false
true
persistence.enabled
Whether to enable persistence
bool
true, false
true
persistence.size
The size of the persistent volume
string
Any
5Gi
podDisruptionBudget.minAvailable
The minimum number of available pods
int
Any
1
service.port
The port of the Service
int
Any
8080
service.type
The type of Service to expose
string
ClusterIP, LoadBalancer
LoadBalancer
serviceAccount.create
Whether to create a ServiceAccount
bool
true, false
false
testFramework.enabled
Whether to enable the test framework
bool
true, false
false
datasources
The datasources section contains the configuration of the datasources
provisioning. See the
Grafana documentation
for more information.
datasources.yaml:apiVersion:1datasources:- name:umh-v2-datasource# <string, required> datasource type. Requiredtype:umh-v2-datasource# <string, required> access mode. proxy or direct (Server or Browser in the UI). Requiredaccess:proxy# <int> org id. will default to orgId 1 if not specifiedorgId:1url:"http://united-manufacturing-hub-factoryinsight-service/"jsonData:customerID:$FACTORYINSIGHT_CUSTOMERIDapiKey:$FACTORYINSIGHT_PASSWORDbaseURL:"http://united-manufacturing-hub-factoryinsight-service/"apiKeyConfigured:trueversion:1# <bool> allow users to edit datasources from the UI.isDefault:falseeditable:false# <string, required> name of the datasource. Required- name:umh-datasource# <string, required> datasource type. Requiredtype:umh-datasource# <string, required> access mode. proxy or direct (Server or Browser in the UI). Requiredaccess:proxy# <int> org id. will default to orgId 1 if not specifiedorgId:1url:"http://united-manufacturing-hub-factoryinsight-service/"jsonData:customerId:$FACTORYINSIGHT_CUSTOMERIDapiKey:$FACTORYINSIGHT_PASSWORDserverURL:"http://united-manufacturing-hub-factoryinsight-service/"apiKeyConfigured:trueversion:1# <bool> allow users to edit datasources from the UI.isDefault:falseeditable:false- name:UMH TimescaleDB type:postgresurl:united-manufacturing-hub:5432user:$GRAFANAREADER_USERisDefault:truesecureJsonData:password:$GRAFANAREADER_PASSWORDjsonData:database:umh_v2sslmode:'require'# disable/require/verify-ca/verify-fullmaxOpenConns:100# Grafana v5.4+maxIdleConns:100# Grafana v5.4+maxIdleConnsAuto:true# Grafana v9.5.1+connMaxLifetime:14400# Grafana v5.4+postgresVersion:1300# 903=9.3, 904=9.4, 905=9.5, 906=9.6, 1000=10timescaledb:true
envValueFrom
The envValueFrom section contains the configuration of the environment
variables to add to the Pod, from a secret or a configmap.
grafana envValueFrom section parameters
Parameter
Description
Value from
Name
Key
FACTORYINSIGHT_APIKEY
The API key to use to authenticate to the Factoryinsight API
secretKeyRef
factoryinsight-secret
apiKey
FACTORYINSIGHT_BASEURL
The base URL of the Factoryinsight API
secretKeyRef
factoryinsight-secret
baseURL
FACTORYINSIGHT_CUSTOMERID
The customer ID to use to authenticate to the Factoryinsight API
secretKeyRef
factoryinsight-secret
customerID
FACTORYINSIGHT_PASSWORD
The password to use to authenticate to the Factoryinsight API
secretKeyRef
factoryinsight-secret
password
GRAFANAREADER_USER
The name of the Grafana read-only user for the data model v2
secretKeyRef"
grafana-secret
grafanareader
GRAFANAREADER_PASSWORD
The password of the Grafana read-only user for the data model v2
secretKeyRef"
grafana-secret
grafanareaderpassword
env
The env section contains the configuration of the environment variables to add
to the Pod.
grafana env section parameters
Parameter
Description
Type
Allowed values
Default
GF_PLUGINS_ALLOW_LOADING_UNSIGNED_PLUGINS
List of plugin identifiers to allow loading even if they lack a valid signature
string
Comma separated list
umh-datasource, umh-v2-datasource
extraInitContainers
The extraInitContainers section contains the configuration of the extra init
containers to add to the Pod.
The init-plugins container is used to install the default plugins shipped with
the UMH version of Grafana without the need to have an internet connection.
See the documentation
for a list of the plugins.
The initContainer section contains the configuration for the init containers.
By default, the hivemqextensioninit container is used to initialize the HiveMQ
extensions.
You shouldn’t need to configure the cache manually, as it’s configured
automatically when the cluster is deployed. However, if you need to change the
configuration, you can do it by editing the redis section of the Helm
chart values file.
You can consult the Bitnami Redis chart
for more information about the available configuration options.
Environment variables
Environment variables
Variable name
Description
Type
Allowed values
Default
ALLOW_EMPTY_PASSWORD
Allow empty password
bool
true, false
false
BITNAMI_DEBUG
Specify if debug values should be set
bool
true, false
false
REDIS_PASSWORD
Redis password
string
Any
Random UUID
REDIS_PORT
Redis port number
int
Any
6379
REDIS_REPLICATION_MODE
Redis replication mode
string
master, slave
master
REDIS_TLS_ENABLED
Enable TLS
bool
true, false
false
9.2.3 - Data Bridge
The technical documentation of the data-bridge microservice,
which transfers data between two Kafka or MQTT brokers, tranforming
the data following the UNS data model.
You shouldn’t need to configure the environment variables directly, as they are
set by the Helm chart. If you need to change them, you can do so by editing the
values in the Helm chart.
Environment variables
Environment variables
Variable name
Description
Type
Allowed values
Default
BROKER_A
The address of the source broker.
string
Any
""
BROKER_B
The address of the destination broker.
string
Any
""
LOGGING_LEVEL
The logging level to use.
string
PRODUCTION, DEVELOPMENT
PRODUCTION
MESSAGE_LRU_SIZE
The size of the LRU cache used to avoid message looping. Only used with MQTT brokers
int
Any
1000000
MICROSERVICE_NAME
Name of the microservice. Used for tracing.
string
Any
united-manufacturing-hub-databridge
MQTT_ENABLE_TLS
Whether to enable TLS for the MQTT connection.
bool
true, false
false
MQTT_PASSWORD
The password to use for the MQTT connection.
string
Any
""
PARTITIONS
The number of partitions to use for the destination topic. Only used if the destination broker is Kafka.
int
Greater than 0
6
POD_NAME
Name of the pod. Used for tracing.
string
Any
united-manufacturing-hub-databridge
REPLICATION_FACTOR
The replication factor to use for the destination topic. Only used if the destination broker is Kafka.
int
Odd integer
3
SERIAL_NUMBER
Serial number of the cluster. Used for tracing.
string
Any
default
SPLIT
The nth part of the topic to use as the message key. If the topic is umh/v1/acme/anytown/foo/bar, and SPLIT is 4, then the message key will be foo.bar
int
Greater than 3
-1
TOPIC
The topic to subscribe to. Can be in either MQTT or Kafka form. Wildcards (# for MQTT, .* for Kafka) are allowed in order to subscribe to multiple topics
string
Any
""
9.2.4 - Database
The technical documentation of the database microservice,
which stores the data of the application.
Kubernetes resources
StatefulSet: united-manufacturing-hub-timescaledb
Service:
Internal ClusterIP for the replicas: united-manufacturing-hub-replica at
port 5432
Internal ClusterIP for the config: united-manufacturing-hub-config at
port 8008
External LoadBalancer: united-manufacturing-hub at
port 5432
There is only one parameter that usually needs to be changed: the password used
to connect to the database. To do so, set the value of the db_password key in
the _000_commonConfig.datastorage
section of the Helm chart values file.
Environment variables
Environment variables
Variable name
Description
Type
Allowed values
Default
BOOTSTRAP_FROM_BACKUP
Whether to bootstrap the database from a backup or not.
int
0, 1
0
PATRONI_KUBERNETES_LABELS
The labels to use to find the pods of the StatefulSet.
You shouldn’t need to configure Factoryinsight manually, as it’s configured
automatically when the cluster is deployed. However, if you need to change the
configuration, you can do it by editing the factoryinsight section of the Helm
chart values file.
Environment variables
Environment variables
Variable name
Description
Type
Allowed values
Default
CUSTOMER_NAME_{NUMBER}
Specifies a user for the REST API. Multiple users can be set
string
Any
""
CUSTOMER_PASSWORD_{NUMBER}
Specifies the password of the user for the REST API
string
Any
""
DEBUG_ENABLE_FGTRACE
Enables the use of the fgtrace library. Not recommended for production
string
true, false
false
DRY_RUN
If enabled, data wont be stored in database
bool
true, false
false
FACTORYINSIGHT_PASSWORD
Specifies the password for the admin user for the REST API
string
Any
Random UUID
FACTORYINSIGHT_USER
Specifies the admin user for the REST API
string
Any
factoryinsight
INSECURE_NO_AUTH
If enabled, no authentication is required for the REST API. Not recommended for production
bool
true, false
false
LOGGING_LEVEL
Defines which logging level is used, mostly relevant for developers
string
PRODUCTION, DEVELOPMENT
PRODUCTION
MICROSERVICE_NAME
Name of the microservice. Used for tracing
string
Any
united-manufacturing-hub-factoryinsight
POSTGRES_DATABASE
Specifies the database name to use
string
Any
factoryinsight
POSTGRES_HOST
Specifies the database DNS name or IP address
string
Any
united-manufacturing-hub
POSTGRES_PASSWORD
Specifies the database password to use
string
Any
changeme
POSTGRES_PORT
Specifies the database port
int
Valid port number
5432
POSTGRES_USER
Specifies the database user to use
string
Any
factoryinsight
REDIS_PASSWORD
Password to access the redis sentinel
string
Any
Random UUID
REDIS_URI
The URI of the Redis instance
string
Any
united-manufacturing-hub-redis-headless:6379
SERIAL_NUMBER
Serial number of the cluster. Used for tracing
string
Any
default
VERSION
The version of the API used. Each version also enables all the previous ones
int
Any
2
API documentation
9.2.6 - Grafana
The technical documentation of the grafana microservice,
which is a web application that provides visualization and analytics capabilities.
Kubernetes resources
Deployment: united-manufacturing-hub-grafana
Service:
External LoadBalancer: united-manufacturing-hub-grafana at
port 8080
You can configure the kafka-bridge microservice by setting the following values
in the _000_commonConfig.kafkaBridge
section of the Helm chart values file.
The topic map is a list of objects, each object represents a topic (or a set of
topics) that should be forwarded. The following JSON schema describes the
structure of the topic map:
{
    "$schema": "http://json-schema.org/draft-07/schema",
    "type": "array",
    "title": "Kafka Topic Map",
    "description": "This schema validates valid Kafka topic maps.",
    "default": [],
    "additionalItems": true,
    "items": {
        "$id": "#/items",
        "anyOf": [
            {
                "$id": "#/items/anyOf/0",
                "type": "object",
                "title": "Unidirectional Kafka Topic Map with send direction",
                "description": "This schema validates entries, that are unidirectional and have a send direction.",
                "default": {},
                "examples": [
                    {
                        "name": "HighIntegrity",
                        "topic": "^ia\\..+\\..+\\..+\\.(?!processValue).+$",
                        "bidirectional": false,
                        "send_direction": "to_remote"
                    }
                ],
                "required": [
                    "name",
                    "topic",
                    "bidirectional",
                    "send_direction"
                ],
                "properties": {
                    "name": {
                        "$id": "#/items/anyOf/0/properties/name",
                        "type": "string",
                        "title": "Entry Name",
                        "description": "Name of the map entry, only used for logging & tracing.",
                        "default": "",
                        "examples": [
                            "HighIntegrity"
                        ]
                    },
                    "topic": {
                        "$id": "#/items/anyOf/0/properties/topic",
                        "type": "string",
                        "title": "The topic to listen on",
                        "description": "The topic to listen on, this can be a regular expression.",
                        "default": "",
                        "examples": [
                            "^ia\\..+\\..+\\..+\\.(?!processValue).+$"
                        ]
                    },
                    "bidirectional": {
                        "$id": "#/items/anyOf/0/properties/bidirectional",
                        "type": "boolean",
                        "title": "Is the transfer bidirectional?",
                        "description": "When set to true, the bridge will consume and produce from both brokers",
                        "default": false,
                        "examples": [
                            false
                        ]
                    },
                    "send_direction": {
                        "$id": "#/items/anyOf/0/properties/send_direction",
                        "type": "string",
                        "title": "Send direction",
                        "description": "Can be either 'to_remote' or 'to_local'",
                        "default": "",
                        "examples": [
                            "to_remote",
                            "to_local"
                        ]
                    }
                },
                "additionalProperties": true
            },
            {
                "$id": "#/items/anyOf/1",
                "type": "object",
                "title": "Bi-directional Kafka Topic Map with send direction",
                "description": "This schema validates entries, that are bi-directional.",
                "default": {},
                "examples": [
                    {
                        "name": "HighIntegrity",
                        "topic": "^ia\\..+\\..+\\..+\\.(?!processValue).+$",
                        "bidirectional": true
                    }
                ],
                "required": [
                    "name",
                    "topic",
                    "bidirectional"
                ],
                "properties": {
                    "name": {
                        "$id": "#/items/anyOf/1/properties/name",
                        "type": "string",
                        "title": "Entry Name",
                        "description": "Name of the map entry, only used for logging & tracing.",
                        "default": "",
                        "examples": [
                            "HighIntegrity"
                        ]
                    },
                    "topic": {
                        "$id": "#/items/anyOf/1/properties/topic",
                        "type": "string",
                        "title": "The topic to listen on",
                        "description": "The topic to listen on, this can be a regular expression.",
                        "default": "",
                        "examples": [
                            "^ia\\..+\\..+\\..+\\.(?!processValue).+$"
                        ]
                    },
                    "bidirectional": {
                        "$id": "#/items/anyOf/1/properties/bidirectional",
                        "type": "boolean",
                        "title": "Is the transfer bidirectional?",
                        "description": "When set to true, the bridge will consume and produce from both brokers",
                        "default": false,
                        "examples": [
                            true
                        ]
                    }
                },
                "additionalProperties": true
            }
        ]
    },
    "examples": [
   {
      "name":"HighIntegrity",
      "topic":"^ia\\..+\\..+\\..+\\.(?!processValue).+$",
      "bidirectional":true
   },
   {
      "name":"HighThroughput",
      "topic":"^ia\\..+\\..+\\..+\\.(processValue).*$",
      "bidirectional":false,
      "send_direction":"to_remote"
   }
]
}
Environment variables
Environment variables
Variable name
Description
Type
Allowed values
Default
DEBUG_ENABLE_FGTRACE
Enables the use of the fgtrace library, do not enable in production
string
true, false
false
KAFKA_GROUP_ID_SUFFIX
Identifier appended to the kafka group ID, usually a serial number
string
Any
defalut
KAFKA_SSL_KEY_PASSWORD_LOCAL
Password for the SSL key pf the local broker
string
Any
""
KAFKA_SSL_KEY_PASSWORD_REMOTE
Password for the SSL key of the remote broker
string
Any
""
KAFKA_TOPIC_MAP
A json map of the kafka topics should be forwarded
External NodePort: united-manufacturing-hub-kafka-external at
port 9094 for the Kafka API listener, port 9644 for the Admin API listener,
port 8083 for the HTTP Proxy listener, and port 8081 for the Schema Registry
listener.
You shouldn’t need to configure the Kafka broker manually, as it’s configured
automatically when the cluster is deployed. However, if you need to change the
configuration, you can do it by editing the redpanda
section of the Helm chart values file.
Environment variables
Environment variables
Variable name
Description
Type
Allowed values
Default
HOST_IP
The IP address of the host machine.
string
Any
Random IP
POD_IP
The IP address of the pod.
string
Any
Random IP
SERVICE_NAME
The name of the service.
string
Any
united-manufacturing-hub-kafka
9.2.9 - Kafka Console
The technical documentation of the kafka-console microservice,
which provides a GUI to interact with the Kafka broker.
Kubernetes resources
Deployment: united-manufacturing-hub-console
Service:
External LoadBalancer: united-manufacturing-hub-console at
port 8090
ConfigMap: united-manufacturing-hub-console
Secret: united-manufacturing-hub-console
Configuration
Environment variables
Environment variables
Variable name
Description
Type
Allowed values
Default
LOGIN_JWTSECRET
The secret used to authenticate the communication to the backend.
string
Any
Random string
9.2.10 - Kafka to Postgresql
The technical documentation of the kafka-to-postgresql microservice,
which consumes messages from a Kafka broker and writes them in a PostgreSQL database.
You shouldn’t need to configure kafka-to-postgresql manually, as it’s configured
automatically when the cluster is deployed. However, if you need to change the
configuration, you can do it by editing the kafkatopostgresql section of the Helm
chart values file.
Environment variables
Environment variables
Variable name
Description
Type
Allowed values
Default
DEBUG_ENABLE_FGTRACE
Enables the use of the fgtrace library. Not recommended for production
string
true, false
false
DRY_RUN
If set to true, the microservice will not write to the database
bool
true, false
false
KAFKA_BOOTSTRAP_SERVER
URL of the Kafka broker used, port is required
string
Any
united-manufacturing-hub-kafka:9092
KAFKA_SSL_KEY_PASSWORD
Key password to decode the SSL private key
string
Any
""
LOGGING_LEVEL
Defines which logging level is used, mostly relevant for developers
string
PRODUCTION, DEVELOPMENT
PRODUCTION
MEMORY_REQUEST
Memory request for the message cache
string
Any
50Mi
MICROSERVICE_NAME
Name of the microservice (used for tracing)
string
Any
united-manufacturing-hub-kafkatopostgresql
POSTGRES_DATABASE
The name of the PostgreSQL database
string
Any
factoryinsight
POSTGRES_HOST
Hostname of the PostgreSQL database
string
Any
united-manufacturing-hub
POSTGRES_PASSWORD
The password to use for PostgreSQL connections
string
Any
changeme
POSTGRES_SSLMODE
If set to true, the PostgreSQL connection will use SSL
string
Any
require
POSTGRES_USER
The username to use for PostgreSQL connections
string
Any
factoryinsight
9.2.11 - Kafka to Postgresql v2
The technical documentation of the kafka-to-postgresql-v2 microservice,
which consumes messages from a Kafka broker and writes them in a PostgreSQL
database by following the UMH data model v2.
You shouldn’t need to configure kafka-to-postgresql-v2 manually, as it’s configured
automatically when the cluster is deployed. However, if you need to change the
configuration, you can do it by editing the kafkatopostgresqlv2 section of the Helm
chart values file.
Environment variables
Environment variables
Variable name
Description
Type
Allowed values
Default
KAFKA_BROKERS
Specifies the URLs and required ports of Kafka brokers using the Kafka protocol.
string
Any
united-manufacturing-hub-kafka:9092
KAFKA_HTTP_BROKERS
Specifies the URLs and required ports of Kafka brokers using the HTTP protocol.
string
Any
united-manufacturing-hub-kafka:8082
LOGGING_LEVEL
Determines the verbosity of the logging output, primarily used for development purposes.
string
PRODUCTION, DEVELOPMENT
PRODUCTION
POSTGRES_DATABASE
Designates the name of the target PostgreSQL database.
string
Any
umh_v2
POSTGRES_HOST
Identifies the hostname for the PostgreSQL database server.
string
Any
united-manufacturing-hub
POSTGRES_LRU_CACHE_SIZE
Determines the size of the Least Recently Used (LRU) cache for asset ID storage. This cache is optimized for minimal memory usage.
string
Any
1000
POSTGRES_PASSWORD
Sets the password for accessing the PostgreSQL database
string
Any
changemetoo
POSTGRES_PORT
Specifies the network port for the PostgreSQL database server.
string
Any
5432
POSTGRES_SSL_MODE
Configures the PostgreSQL connection to use SSL if set to ’true'.
string
Any
require
POSTGRES_USER
Defines the username for PostgreSQL database access.
string
Any
kafkatopostgresqlv2
VALUE_CHANNEL_SIZE
Sets the size of the channel for message storage prior to insertion. This parameter is significant for memory consumption
string
Any
10000
WORKER_MULTIPLIER
This multiplier affects the number of workers converting Kafka messages into the PostgreSQL schema. Total workers = cores * multiplier.
string
Any
16
9.2.12 - MQTT Broker
The technical documentation of the mqtt-broker microservice,
which forwards MQTT messages between the other microservices.
Kubernetes resources
StatefulSet: united-manufacturing-hub-hivemqce
Service:
Internal ClusterIP:
HiveMQ local: united-manufacturing-hub-hivemq-local-service at
port 1883 (MQTT) and 8883 (MQTT over TLS)
VerneMQ (for backwards compatibility): united-manufacturing-hub-vernemq at
port 1883 (MQTT) and 8883 (MQTT over TLS)
VerneMQ local (for backwards compatibility): united-manufacturing-hub-vernemq-local-service at
port 1883 (MQTT) and 8883 (MQTT over TLS)
External LoadBalancer: united-manufacturing-hub-mqtt at
port 1883 (MQTT) and 8883 (MQTT over TLS)
You shouldn’t need to configure mqtt-kafka-bridge manually, as it’s configured
automatically when the cluster is deployed. However, if you need to change the
configuration, you can do it by editing the mqttkafkabridge section of the Helm
chart values file.
Environment variables
Environment variables
Variable name
Description
Type
Allowed values
Default
DEBUG_ENABLE_FGTRACE
Enables the use of the fgtrace library. Not recommended for production
string
true, false
false
INSECURE_SKIP_VERIFY
Skip TLS certificate verification
bool
true, false
true
KAFKA_BASE_TOPIC
The Kafka base topic
string
Any
ia
KAFKA_BOOTSTRAP_SERVER
URL of the Kafka broker used, port is required
string
Any
united-manufacturing-hub-kafka:9092
KAFKA_LISTEN_TOPIC
Kafka topic to subscribe to. Accept regex values
string
Any
^ia.+
KAFKA_SENDER_THREADS
Number of threads used to send messages to Kafka
int
Any
1
LOGGING_LEVEL
Defines which logging level is used, mostly relevant for developers
string
PRODUCTION, DEVELOPMENT
PRODUCTION
MESSAGE_LRU_SIZE
Size of the LRU cache used to store messages. This is used to prevent duplicate messages from being sent to Kafka.
int
Any
100000
MICROSERVICE_NAME
Name of the microservice (used for tracing)
string
Any
united-manufacturing-hub-mqttkafkabridge
MQTT_BROKER_URL
The MQTT broker URL
string
Any
united-manufacturing-hub-mqtt:1883
MQTT_CERTIFICATE_NAME
Set to NO_CERT to allow non-encrypted MQTT access, or to USE_TLS to use TLS encryption
You can change the configuration of the microservice by updating the config.json
file in the ConfigMap.
9.2.15 - MQTT to Postgresql
The technical documentation of the mqtt-to-postgresql microservice,
which consumes messages from an MQTT broker and writes them in a PostgreSQL
database.
9.2.16 - Node-RED
The technical documentation of the nodered microservice,
which wires together hardware devices, APIs and online services.
Kubernetes resources
StatefulSet: united-manufacturing-hub-nodered
Service:
External LoadBalancer: united-manufacturing-hub-nodered-service at
port 1880
You can enable the nodered microservice and decide if you want to use the
default flows in the _000_commonConfig.dataprocessing.nodered
section of the Helm chart values.
All the other values are set by default and you can find them in the
Danger Zone section of the Helm chart values.
Environment variables
Environment variables
Variable name
Description
Type
Allowed values
Default
NODE_RED_ENABLE_SAFE_MODE
Enable safe mode, useful in case of broken flows
boolean
true, false
false
TZ
The timezone used by Node-RED
string
Any
Berlin/Europe
9.2.17 - OPCUA Simulator
The technical documentation of the opcua-simulator microservice,
which simulates OPCUA devices.
You shouldn’t need to configure PackML Simulator manually, as it’s configured
automatically when the cluster is deployed. However, if you need to change the
configuration, you can do it by editing the packmlmqttsimulator section of the
Helm chart values file.
Environment variables
Environment variables
Variable name
Description
Type
Allowed values
Default
AREA
ISA-95 area name of the line
string
Any
DefaultArea
LINE
ISA-95 line name of the line
string
Any
DefaultProductionLine
MQTT_PASSWORD
Password for the MQTT broker. Leave empty if the server does not manage permissions
string
Any
INSECURE_INSECURE_INSECURE
MQTT_URL
Server URL of the MQTT server
string
Any
mqtt://united-manufacturing-hub-mqtt:1883
MQTT_USERNAME
Name for the MQTT broker. Leave empty if the server does not manage permissions
string
Any
PACKMLSIMULATOR
SITE
ISA-95 site name of the line
string
Any
testLocation
9.2.19 - Sensorconnect
The technical documentation of the sensorconnect microservice,
which reads data from sensors and sends them to the MQTT or Kafka broker.
You can configure the IP range to scan for gateways, and which message broker to
use, by setting the values of the parameters in the
_000_commonConfig.datasources.sensorconnect
section of the Helm chart values file.
The default values of the other parameters are usually good for most use cases,
but you can change them in the Danger Zone section of the Helm chart values file.
If you want to increase the polling speed of the sensors, you can do so by
setting the sensorconnect.lowerPollingTime parameter to a lower value. This
can cause the ifm IO-link master to become unresponsive, if its firmware is
not up to date.
Environment variables
Environment variables
Variable name
Description
Type
Allowed values
Default
ADDITIONAL_SLEEP_TIME_PER_ACTIVE_PORT_MS
Additional sleep time between pollings for each active port
float
Any
0.0
ADDITIONAL_SLOWDOWN_MAP
JSON map of values, allows to slow down and speed up the polling time of specific sensors
Enables the use of the fgtrace library. Not recommended for production
string
true, false
false
DEVICE_FINDER_TIMEOUT_SEC
HTTP timeout in seconds for finding new devices
int
Any
1
DEVICE_FINDER_TIME_SEC
Time interval in seconds for finding new devices
int
Any
20
IODD_FILE_PATH
Filesystem path where to store IODD files
string
Any valid Unix path
/ioddfiles
IP_RANGE
The IP range to scan for new sensor
string
Any valid IP in CIDR notation
192.168.10.1/24
KAFKA_BOOTSTRAP_SERVER
URL of the Kafka broker. Port is required
string
Any
united-manufacturing-hub-kafka:9092
KAFKA_SSL_KEY_PASSWORD
The encrypted password of the SSL key. If empty, no password is used
string
Any
""
KAFKA_USE_SSL
Set to true to use SSL encryption for the connection to the Kafka broker
string
true, false
false
LOGGING_LEVEL
Defines which logging level is used, mostly relevant for developers
string
PRODUCTION, DEVELOPMENT
PRODUCTION
LOWER_POLLING_TIME_MS
Time in milliseconds to define the lower bound of time between sensor polling
int
Any
100
MAX_SENSOR_ERROR_COUNT
Amount of errors before a sensor is temporarily disabled
int
Any
50
MICROSERVICE_NAME
Name of the microservice (used for tracing)
string
Any
united-manufacturing-hub-sensorconnect
MQTT_BROKER_URL
URL of the MQTT broker. Port is required
string
Any
united-manufacturing-hub-mqtt:1883
MQTT_CERTIFICATE_NAME
Set to NO_CERT to allow non-encrypted MQTT access, or to USE_TLS to use TLS encryption
string
USE_TLS, NO_CERT
USE_TLS
MQTT_PASSWORD
Password for the MQTT broker
string
Any
INSECURE_INSECURE_INSECURE
POD_NAME
Name of the pod (used for tracing)
string
Any
united-manufacturing-hub-sensorconnect-0
POLLING_SPEED_STEP_DOWN_MS
Time in milliseconds subtracted from the polling interval after a successful polling
int
Any
1
POLLING_SPEED_STEP_UP_MS
Time in milliseconds added to the polling interval after a failed polling
int
Any
20
SENSOR_INITIAL_POLLING_TIME_MS
Amount of time in milliseconds before starting to request sensor data. Must be higher than LOWER_POLLING_TIME_MS
int
Any
100
SUB_TWENTY_MS
Set to 1 to allow LOWER_POLLING_TIME_MS of under 20 ms. This is not recommended as it might lead to the gateway becoming unresponsive until a manual reboot
int
0, 1
0
TEST
If enabled, the microservice will use a test IODD file from the filesystem to use with a mocked sensor. Only useful for development.
string
true, false
false
TRANSMITTERID
Serial number of the cluster (used for tracing)
string
Any
default
UPPER_POLLING_TIME_MS
Time in milliseconds to define the upper bound of time between sensor polling
int
Any
1000
USE_KAFKA
If enabled, uses Kafka as a message broker
string
true, false
true
USE_MQTT
If enabled, uses MQTT as a message broker
string
true, false
false
Slowdown map
The ADDITIONAL_SLOWDOWN_MAP environment variable allows you to slow down and
speed up the polling time of specific sensors. It is a JSON array of values, with
the following structure:
The technical documentation of the tulip-connector microservice,
which exposes internal APIs, such as factoryinsight, to the internet.
Specifically designed to communicate with Tulip.
You can enable the tulip-connector and set the domain for the ingress by editing
the values in the _000_commonConfig.tulipconnector
section of the Helm chart values file.
Environment variables
Environment variables
Variable name
Description
Type
Allowed values
Default
FACTORYINSIGHT_PASSWORD
Specifies the password for the admin user for the REST API
string
Any
Random UUID
FACTORYINSIGHT_URL
Specifies the URL of the factoryinsight microservice.
Specifies the mode that the service will run in. Change only during development
string
dev, prod
prod
API documentation
10 - Development
These pages describe advanced topics for developers.
10.1 - Contribute
Learn how to contribute to the United Manufacturing Hub project.
Welcome
Welcome to the United Manufacturing Hub project! We’re excited that you want to
contribute to the project. The following documents cover some important aspects
of contributing to the United Manufacturing Hub or its documentation.
UMH Systems welcomes improvements from all contributors, new and experienced!
The first place to start is the Getting Started With Contributing
page. It provides a high-level overview of the contribution process.
10.1.1 - Getting Started With Contributing
A small list of things that you should read and be familiar with before you
get started with contributing.
Welcome
This document is the single source of truth for how to contribute to the code
base. Feel free to browse the open issues and file new ones, all feedback
is welcome!
Prerequisites
Before you begin contributing, you should first complete the following prerequisites:
Create a GitHub account
Before you get started, you will need to sign up for
a GitHub user account.
The development environment changes depending on the type of contribution you
want to make.
If you plan to contribute documentation changes, you can use the GitHub UI to
edit the files. Otherwise, you can follow the instructions in the
documentation
to set up your environment.
If you plan to contribute code changes, review the
developer resources
page for how to set up your environment.
Find something to work on
The first step to getting starting contributing to United Manufacturing Hub is
to find something to work on. Help is always welcome, and no contribution is too
small!
Here are some things you can do today to get started contributing:
Help improve the United Manufacturing Hub documentation
Clarify code, variables, or functions that can be renamed or commented on
Write test coverage
If the above suggestions don’t appeal to you, you can browse the issues labeled
as a good first issue to see who is looking for help.
Look at the issue section of any of our repositories to find issues that are
currently open. Don’t be afraid to ask questions if you are interested in
contributing to a specific issue.
When you find something you want to work on, you can assign the issue to yourself.
Make your changes
Once you have found something to work on, you can start making your changes.
Follow the contributing guidelines.
Open a pull request
Once you have made your changes, you can submit them for review. You can do this
by creating a pull request (PR) against the main branch of the repository.
Code review
Once you have submitted your changes, a maintainer will review your changes and
provide feedback.
As a community we believe in the value of code review for all contributions.
Code review increases both the quality and readability of our codebase, which in
turn produces high quality software.
If the PR will completely fix a specific issue, include fixes #123 in the PR
body (where 123 is the specific issue number the PR will fix). This will
automatically close the issue when the PR is merged.
Make sure you don’t include @mentions or fixes keywords in your git commit
messages. These should be included in the PR body instead.
When you make a PR for small change (such as fixing a typo, style change, or
grammar fix), please squash your commits so that we can maintain a cleaner git
history.
Make sure you include a clear and detailed PR description explaining the reasons
for the changes, and ensuring there is sufficient information for the reviewer
to understand your PR.
Testing is the responsibility of all contributors. It is important to ensure that
all code is tested and that all tests pass. This ensures that the code base is
stable and reliable.
There are multiple type of tests. The location of the test code vaires with type,
as do the specifics of the environment needed to succesfully run the test:
Unit: these confirm that a particular function behaves as intended. Golang
includes a native ability for unit testing via the testing
package. Unit test source code can be found adjacent tot the corresponding
source code within a given package. These are easily run by any developer on
any OS.
Integration: these tests cover interactions of package components or interactions
between UMH components and some external system. An example would be testing
whether a piece of code can correctly store data in tha database.
Running these tests can require the developer to set up additional functionality
on their development system.
End-to-end (“e2e”): these are broad test of overall system behavior and
coherence. These are more complicated as they require a functional Kubernetes
cluster. There are some e2e tests running in pipelines, and if your changes
require e2e tests, you will need to add them to the pipeline. You can find
more information about the CI pipelines in the CI documentation.
Documentation
Documentation is an important part of any project. It is important to ensure that
all code is documented and that all documentation is up to date.
Learn more in-depth about how to contribute new content to the United Manufacturing Hub.
10.1.2.1 - GitHub Workflow
This document is an overview of the GitHub workflow used by the
United Manufacturing Hub project. It includes tips and suggestions on keeping
your local environment in sync with upstream and how to maintain good commit
hygiene.
Click Fork button (top right) to establish a cloud-based fork.
2. Clone fork to local storage
Per Go’s workspace instructions,
place United Manufacturing Hub’s code on your GOPATH using the following cloning procedure.
In your shell, define a local working directory as working_dir. If your GOPATH
has multiple paths, pick just one and use it instead of $GOPATH. You must follow
exactly this pattern, neither $GOPATH/src/github.com/${your github profile name}/
nor any other pattern will work.
The following instructions assume you are using a bash shell. If you are using a
different shell, you will need to adjust the commands accordingly.
Both $working_dir and $user are mentioned in the figure above.
Create your clone:
mkdir -p $working_dircd$working_dirgit clone https://github.com/$user/united-manufacturing-hub.git
# or: git clone [email protected]:$user/united-manufacturing-hub.gitcd$working_dir/united-manufacturing-hub
git remote add origin https://github.com/united-manufacturing-hub/united-manufacturing-hub.git
# or: git remote add upstream [email protected]:united-manufacturing-hub/united-manufacturing-hub.git# Never push to upstream mastergit remote set-url --push origin no_push
# Confirm that your remotes make sense:git remote -v
3. Create a Working Branch
Get your local master up to date.
cd$working_dir/united-manufacturing-hub
git fetch origin
git checkout main
git rebase origin/main
Create your new branch.
git checkout -b myfeature
You may now edit files on the myfeature branch.
4. Keep your branch in sync
You will need to periodically fetch changes from the origin
repository to keep your working branch in sync.
Make sure your local repository is on your working branch and run the
following commands to keep it in sync:
git fetch origin
git rebase origin/main
Please don’t use git pull instead of the above fetch and
rebase. Since git pull executes a merge, it creates merge commits. These make
the commit history messy and violate the principle that commits ought to be
individually understandable and useful (see below).
You might also consider changing your .git/config file via
git config branch.autoSetupRebase always to change the behavior of git pull,
or another non-merge option such as git pull --rebase.
5. Commit Your Changes
You will probably want to regularly commit your changes. It is likely that you will go back and edit,
build, and test multiple times. After a few cycles of this, you might
amend your previous commit.
git commit
6. Push to GitHub
When your changes are ready for review, push your working branch to
your fork on GitHub.
git push -f <your_remote_name> myfeature
7. Create a Pull Request
Visit your fork at https://github.com/<user>/united-manufacturing-hub
Click the Compare & Pull Request button next to your myfeature branch.
Check out the pull request process for more details and
advice.
Get a code review
Once your pull request has been opened it will be assigned to one or more
reviewers. Those reviewers will do a thorough code review, looking for
correctness, bugs, opportunities for improvement, documentation and comments,
and style.
Commit changes made in response to review comments to the same branch on your
fork.
Very small PRs are easy to review. Very large PRs are very difficult to review.
Squash commits
After a review, prepare your PR for merging by squashing your commits.
All commits left on your branch after a review should represent meaningful
milestones or units of work. Use commits to add clarity to the development and
review process.
Before merging a PR, squash the following kinds of commits:
Fixes/review feedback
Typos
Merges and rebases
Work in progress
Aim to have every commit in a PR compile and pass tests independently if you can,
but it’s not a requirement. In particular, merge commits must be removed, as
they will not pass tests.
On branch your-contribution
Your branch is up to date with 'origin/your-contribution'.
Start an interactive rebase using a specific commit hash, or count backwards from your last commit using HEAD~<n>, where <n> represents the number of commits to include in the rebase.
git rebase -i HEAD~3
The output should be similar to this:
pick 2ebe926 Original commit
pick 31f33e9 Address feedback
pick b0315fe Second unit of work

# Rebase 7c34fc9..b0315ff onto 7c34fc9 (3 commands)
#
# Commands:
# p, pick <commit> = use commit
# r, reword <commit> = use commit, but edit the commit message
# e, edit <commit> = use commit, but stop for amending
# s, squash <commit> = use commit, but meld into previous commit
# f, fixup <commit> = like "squash", but discard this commit's log message

...
Use a command line text editor to change the word pick to squash for the commits you want to squash, then save your changes and continue the rebase:
pick 2ebe926 Original commit
squash 31f33e9 Address feedback
pick b0315fe Second unit of work

...
The output after saving changes should look similar to this:
[detached HEAD 61fdded] Second unit of work
 Date: Thu Mar 5 19:01:32 2020 +0100
 2 files changed, 15 insertions(+), 1 deletion(-)

 ...

Successfully rebased and updated refs/heads/master.
Force push your changes to your remote branch:
git push --force
For mass automated fixups such as automated doc formatting, use one or more
commits for the changes to tooling and a final commit to apply the fixup en
masse. This makes reviews easier.
By squashing locally, you control the commit message(s) for your work, and can
separate a large PR into logically separate changes.
For example: you have a pull request that is code complete and has 24 commits.
You rebase this against the same merge base, simplifying the change to two commits.
Each of those two commits represents a single logical change and each commit
message summarizes what changes. Reviewers see that the set of changes are now
understandable, and approve your PR.
Merging a commit
Once you’ve received review and approval, your commits are squashed, your PR is
ready for merging.
Merging happens automatically after both a Reviewer and Approver have approved
the PR. If you haven’t squashed your commits, they may ask you to do so before
approving a PR.
Reverting a commit
In case you wish to revert a commit, use the following instructions.
If you have upstream write access, please refrain from using the
Revert button in the GitHub UI for creating the PR, because GitHub
will create the PR branch inside the main repository rather than inside your fork.
Create a branch and sync it with upstream.
# create a branchgit checkout -b myrevert
# sync the branch with upstreamgit fetch origin
git rebase origin/main
If the commit you wish to revert is a merge commit, use this command:
# SHA is the hash of the merge commit you wish to revertgit revert -m 1 <SHA>
If it is a single commit, use this command:
# SHA is the hash of the single commit you wish to revertgit revert <SHA>
This will create a new commit reverting the changes. Push this new commit to your remote.
Explains the process and best practices for submitting a pull request to the
United Manufacturing Hub project and its associated sub-repositories. It should serve as a
reference for all contributors, and be useful especially to new or infrequent
submitters.
This doc explains the process and best practices for submitting a pull request
to the United Manufacturing Hub
project and its associated sub-repositories. It should serve as a reference for
all contributors, and be useful especially to new and infrequent submitters.
Before You Submit a Pull Request
This guide is for contributors who already have a pull request to submit.
If you’re looking for information on setting up your developer environment and
creating code to contribute to United Manufacturing Hub, or you are a first-time
contributor, see the
Contributor Guide to get started.
Make sure your pull request adheres to our best practices.
These include following project conventions, making small pull requests, and
commenting thoroughly. Please read the more detailed section on
Best Practices for Faster Reviews at the
end of this doc.
The Pull Request Submit Process
Merging a pull request requires the following steps to be completed before the
pull request will be merged.
Get all necessary approvals from reviewers and code owners
Marking Unfinished Pull Requests
If you want to solicit reviews before the implementation of your pull request is
complete, you should hold your pull request to ensure that a maintainer does not
merge it prematurely.
There are three methods to achieve this:
You may add the status: in-progress or status: on-hold labels
You may add or remove a WIP or [WIP] prefix to your pull request title
You may open your pull request in a draft state
While either method is acceptable, we recommend using the status: in-progress
label.
How the e2e Tests Work
United Manufacturing Hub runs a set of end-to-end tests (e2e tests) on pull
requests. You can find an overview of the tests in the
CI documentation.
Why was my pull request closed?
Closed pull requests are easy to recreate, and little work is lost by closing a
pull request that subsequently needs to be reopened.
We want to limit the total number of pull requests in flight to:
Maintain a clean project
Remove old pull requests that would be difficult to rebase as the underlying
code has changed over time
Encourage code velocity
Best Practices for Faster Reviews
Most of this section is not specific to United Manufacturing Hub, but it’s good to keep these
best practices in mind when you’re making a pull request.
You’ve just had a brilliant idea on how to make United Manufacturing Hub better.
Let’s call that idea Feature-X.
Feature-X is not even that complicated.
You have a pretty good idea of how to implement it.
You jump in and implement it, fixing a bunch of stuff along the way.
You send your pull request - this is awesome!
And it sits.
And sits.
A week goes by and nobody reviews it.
Finally, someone offers a few comments, which you fix up and wait for more review.
And you wait.
Another week or two go by. This is horrible.
Let’s talk about best practices so your pull request gets reviewed quickly.
Is the feature wanted? File a United Manufacturing Hub Enhancement Proposal
Are you sure Feature-X is something the UMH team wants or will accept?
Is it implemented to fit with other changes in flight?
Are you willing to bet a few days or weeks of work on it?
It’s better to get confirmation beforehand.
Even for small changes, it is often a good idea to gather feedback on an issue
you filed, or even simply ask in UMH Discord channel to invite discussion and
feedback from code owners.
KISS, YAGNI, MVP, etc
Sometimes we need to remind each other of core tenets of software design -
Keep It Simple, You Aren’t Gonna Need It, Minimum Viable Product, and so on.
Adding a feature “because we might need it later” is antithetical to software that ships.
Add the things you need NOW and (ideally) leave room for things you might need
later - but don’t implement them now.
Smaller Is Better: Small Commits, Small Pull Requests
Small commits and small pull requests get reviewed faster and are more likely to
be correct than big ones.
Attention is a scarce resource.
If your pull request takes 60 minutes to review, the reviewer’s eye for detail is
not as keen in the last 30 minutes as it was in the first.
It might not get reviewed at all if it requires a large continuous block of time
from the reviewer.
Breaking up commits
Break up your pull request into multiple commits, at logical break points.
Making a series of discrete commits is a powerful way to express the evolution of
an idea or the different ideas that make up a single feature.
Strive to group logically distinct ideas into separate commits.
For example, if you found that Feature-X needed some prefactoring to fit in, make
a commit that JUST does that prefactoring.
Then make a new commit for Feature-X.
Strike a balance with the number of commits.
A pull request with 25 commits is still very cumbersome to review, so use your
best judgment.
Breaking up Pull Requests
Or, going back to our prerefactoring example, you could also fork a new branch,
do the prefactoring there and send a pull request for that.
If you can extract whole ideas from your pull request and send those as pull
requests of their own, you can avoid the painful problem of continually rebasing.
Multiple small pull requests are often better than multiple commits.
Don’t worry about flooding us with pull requests. We’d rather have 100 small,
obvious pull requests than 10 unreviewable monoliths.
We want every pull request to be useful on its own, so use your best judgment on
what should be a pull request vs. a commit.
As a rule of thumb, if your pull request is directly related to Feature-X and
nothing else, it should probably be part of the Feature-X pull request.
If you can explain why you are doing seemingly no-op work
(“it makes the Feature-X change easier, I promise”) we’ll probably be OK with it.
If you can imagine someone finding value independently of Feature-X, try it as a
pull request.
(Do not link pull requests by # in a commit description, because GitHub creates
lots of spam. Instead, reference other pull requests via the pull request your
commit is in.)
Open a Different Pull Request for Fixes and Generic Features
Put changes that are unrelated to your feature into a different pull request
Often, as you are implementing Feature-X, you will find bad comments, poorly
named functions, bad structure, weak type-safety, etc.
You absolutely should fix those things (or at least file issues, please) - but
not in the same pull request as your feature. Otherwise, your diff will have way
too many changes, and your reviewer won’t see the forest for the trees.
Look for opportunities to pull out generic features
For example, if you find yourself touching a lot of modules, think about the
dependencies you are introducing between packages.
Can some of what you’re doing be made more generic and moved up and out of the
Feature-X package?
Do you need to use a function or type from an otherwise unrelated package?
If so, promote!
We have places for hosting more generic code.
Likewise, if Feature-X is similar in form to Feature-W which was checked in last
month, and you’re duplicating some tricky stuff from Feature-W, consider
prerefactoring the core logic out and using it in both Feature-W and Feature-X.
(Do that in its own commit or pull request, please.)
Comments Matter
In your code, if someone might not understand why you did something (or you won’t
remember why later), comment it. Many code-review comments are about this exact
issue.
If you think there’s something pretty obvious that we could follow up on, add a TODO.
Read up on GoDoc - follow
those general rules for comments.
Test
Nothing is more frustrating than starting a review, only to find that the tests
are inadequate or absent.
Very few pull requests can touch the code and NOT touch tests.
If you don’t know how to test Feature-X, please ask!
We’ll be happy to help you design things for easy testing or to suggest
appropriate test cases.
Squashing
Your reviewer has finally sent you feedback on Feature-X.
Make the fixups, and don’t squash yet.
Put them in a new commit, and re-push.
That way your reviewer can look at the new commit on its own, which is much
faster than starting over.
We might still ask you to clean up your commits at the very end for the sake of
a more readable history, but don’t do this until asked: typically at the point
where the pull request would otherwise be tagged LGTM.
Each commit should have a good title line (<70 characters) and include an
additional description paragraph describing in more detail the change intended.
Do squash when there are several commits to fix bugs in the original commit(s),
address reviewer feedback, etc.
Really we only want to see the end state, and commit message for the whole
pull request.
Layers => don’t squash
Don’t squash when there are independent changes layered to achieve a single goal.
For instance, writing a code munger could be one commit, applying it could be
another, and adding a precommit check could be a third.
One could argue they should be separate pull requests, but there’s really no
way to test/review the munger without seeing it applied, and there needs to be
a precommit check to ensure the munged output doesn’t immediately get out of date.
Commit Message Guidelines
PR comments are not represented in the commit history.
Commits and their commit messages are the “permanent record” of the changes
being done in your PR and their commit messages should accurately describe both
what and why it is being done.
Commit messages are comprised of two parts; the subject and the body.
The subject is the first line of the commit message and is often the only part
that is needed for small or trivial changes.
Those may be done as “one liners” with the git commit -m or the --message
flag, but only if the what and especially why can be fully described in that few
words.
The commit message body is the portion of text below the subject when you run
git commit without the -m flag which will open the commit message for editing
in your preferred editor.
Typing a few further sentences of clarification is a useful investment in time
both for your reviews and overall later project maintenance.
This is the commit message subject

Any text here is the commit message body
Some text
Some more text
...

# Please enter the commit message for your changes. Lines starting
# with '#' will be ignored, and an empty message aborts the commit.
#
# On branch example
# Changes to be committed:
#   ...
#
Use these guidelines below to help craft a well formatted commit message.
These can be largely attributed to the previous work of Chris Beams, Tim Pope,
Scott Chacon and Ben Straub.
The conventional commit format is a lightweight convention on top of commit
messages.
It provides an easy set of rules for creating an explicit commit history;
which makes it easier to write automated tools on top of.
The commit message should be structured as follows:
The type and description fields are mandatory, the scope field is optional.
The body and footer are optional and can be used to provide additional
context.
Try to keep the subject line to 50 characters or less; do not exceed 72 characters
The 50 character limit for the commit message subject line acts as a focus to
keep the message summary as concise as possible.
It should be just enough to describe what is being done.
The hard limit of 72 characters is to align with the max body size.
When viewing the history of a repository with git log, git will pad the body
text with additional blank spaces.
Wrapping the width at 72 characters ensures the body text will be centered and
easily viewable on an 80-column terminal.
Do not end the commit message subject with a period
This is primary intended to serve as a space saving measure, but also aids in
driving the subject line to be as short and concise as possible.
Use imperative mood in your commit message subject
Imperative mood can be be thought of as a “giving a command”; it is a
present-tense statement that explicitly describes what is being done.
Good Examples:
fix: x error in y
feat: add foo to bar
Revert commit “baz”
docs: update pull request guidelines
Bad Examples:
fix: Fixed x error in y
feat: Added foo to bar
Reverting bad commit “baz”
docs: Updating the pull request guidelines
Fixing more things
Add a single blank line before the commit message body
Git uses the blank line to determine which portion of the commit message is the
subject and body.
Text preceding the blank line is the subject, and text following is considered the body.
Wrap the commit message body at 72 characters
The default column width for git is 80 characters.
Git will pad the text of the message body with an additional 4 spaces when viewing the git log.
This would leave you with 76 available spaces for text, however the text would be “lop-sided”.
To center the text for better viewing, the other side is artificially padded
with the same amount of spaces, resulting in 72 usable characters per line.
Think of them as the margins in a word doc.
Do not use GitHub keywords or (@)mentions within your commit message
GitHub Keywords
Using GitHub keywords followed by a #<issue number> reference within your
commit message will automatically apply the do-not-merge/invalid-commit-message
label to your PR preventing it from being merged.
GitHub keywords in a PR to close issues is considered a convenience item, but
can have unexpected side-effects when used in a commit message; often closing
something they shouldn’t.
Blocked Keywords:
close
closes
closed
fix
fixes
fixed
resolve
resolves
resolved
(@)Mentions
(@)mentions within the commit message will send a notification to that user, and
will continually do so each time the PR is updated.
Use the commit message body to explain the what and why of the commit
Commits and their commit messages are the “permanent record” of the changes
being done in your PR.
Describing why something has changed and what effects it may have.
You are providing context to both your reviewer and the next person that has to
touch your code.
If something is resolving a bug, or is in response to a specific issue, you can
link to it as a reference with the message body itself.
These sorts of breadcrumbs become essential when tracking down future bugs or
regressions and further help explain the “why” the commit was made.
Sometimes reviewers make mistakes.
It’s OK to push back on changes your reviewer requested.
If you have a good reason for doing something a certain way, you are absolutely
allowed to debate the merits of a requested change.
Both the reviewer and reviewee should strive to discuss these issues in a polite
and respectful manner.
You might be overruled, but you might also prevail.
We’re pretty reasonable people.
Another phenomenon of open-source projects (where anyone can comment on any issue)
is the dog-pile - your pull request gets so many comments from so many people it
becomes hard to follow.
In this situation, you can ask the primary reviewer (assignee) whether they want
you to fork a new pull request to clear out all the comments.
You don’t HAVE to fix every issue raised by every person who feels like commenting,
but you should answer reasonable comments with an explanation.
Common Sense and Courtesy
No document can take the place of common sense and good taste.
Use your best judgment, while you put a bit of thought into how your work can be
made easier to review.
If you do these things your pull requests will get merged with less friction.
Trivial Edits
Each incoming Pull Request needs to be reviewed, checked, and then merged.
While automation helps with this, each contribution also has an engineering cost.
Therefore it is appreciated if you do NOT make trivial edits and fixes, but
instead focus on giving the entire file a review.
If you find one grammatical or spelling error, it is likely there are more in
that file, you can really make your Pull Request count by checking the formatting,
checking for broken links, and fixing errors and then submitting all the fixes
at once to that file.
Some questions to consider:
Can the file be improved further?
Does the trivial edit greatly improve the quality of the content?
10.1.2.3 - Adding Documentation
Learn how to add documentation to the United Manufacturing Hub.
To contribute new content pages or improve existing content pages, open a pull request (PR).
Make sure you follow all the general contributing guidelines in the
Getting started section, as
well as the documentation specific guidelines.
If your change is small, or you’re unfamiliar with git, read
Changes using GitHub to learn how to edit a page.
If your changes are large, read Work from a local fork to learn how to make
changes locally on your computer.
Contributing basics
Write United Manufacturing Hub documentation in Markdown and build the UMH docs
site using Hugo.
In addition to the standard Hugo shortcodes, we use a number of
custom Hugo shortcodes in our
documentation to control the presentation of content.
Documentation source is available in multiple languages in /content/. Each
language has its own folder with a two-letter code determined by the
ISO 639-1 standard
. For example, English documentation source is stored in /content/en/docs/.
For more information about contributing to documentation in multiple languages
or starting a new translation,
see localization.
Changes using GitHub
If you’re less experienced with git workflows, here’s an easier method of
opening a pull request. Figure 1 outlines the steps and the details follow.
flowchart LR
A([fa:fa-user New Contributor]) --- id1[(umh/umh.docs.umh.app GitHub)]
subgraph tasks[Changes using GitHub]
direction TB
0[ ] -.-
1[1. Edit this page] --> 2[2. Use GitHub markdown editor to make changes]
2 --> 3[3. fill in Propose file change]
end
subgraph tasks2[ ]
direction TB
4[4. select Propose file change] --> 5[5. select Create pull request] --> 6[6. fill in Open a pull request]
6 --> 7[7. select Create pull request]
end
id1 --> tasks --> tasks2
classDef grey fill:#dddddd,stroke:#ffffff,stroke-width:px,color:#000000, font-size:15px;
classDef white fill:#ffffff,stroke:#000,stroke-width:px,color:#000,font-weight:bold
classDef k8s fill:#326ce5,stroke:#fff,stroke-width:1px,color:#fff;
classDef spacewhite fill:#ffffff,stroke:#fff,stroke-width:0px,color:#000
class A,1,2,3,4,5,6,7 grey
class 0 spacewhite
class tasks,tasks2 white
class id1 k8s
On the page where you see the issue, select the Edit this page option in
the right-hand side navigation panel.
Make your changes in the GitHub markdown editor.
Below the editor, fill in the Propose file change form.
In the first field, give your commit message a title.
In the second field, provide a description.
Do not use any GitHub Keywords
in your commit message. You can add those to the pull request description later.
Select Propose file change.
Select Create pull request.
The Open a pull request screen appears. Fill in the form:
The Subject field of the pull request defaults to the commit summary.
You can change it if needed.
The Body contains your extended commit message, if you have one,
and some template text. Add the
details the template text asks for, then delete the extra template text.
Leave the Allow edits from maintainers checkbox selected.
PR descriptions are a great way to help reviewers understand your change.
For more information, see Opening a PR.
Select Create pull request.
Addressing feedback in GitHub
Before merging a pull request, UMH community members review and
approve it. If you have someone specific in mind, leave a comment with their
GitHub username in it.
If a reviewer asks you to make changes:
Go to the Files changed tab.
Select the pencil (edit) icon on any files changed by the pull request.
Make the changes requested.
Commit the changes.
When your review is complete, a reviewer merges your PR and your changes go live
a few minutes later.
Work from a local fork
If you’re more experienced with git, or if your changes are larger than a few lines,
work from a local fork.
Figure 2 shows the steps to follow when you work from a local fork. The details for each step follow.
flowchart LR
1[Fork the umh/umh.docs.umh.app repository] --> 2[Create local clone and set upstream]
subgraph changes[Your changes]
direction TB
S[ ] -.-
3[Create a branch example: my_new_branch] --> 3a[Make changes using text editor] --> 4["Preview your changes locally using Hugo (localhost:1313)"]
end
subgraph changes2[Commit / Push]
direction TB
T[ ] -.-
5[Commit your changes] --> 6[Push commit to origin/my_new_branch]
end
2 --> changes --> changes2
classDef grey fill:#dddddd,stroke:#ffffff,stroke-width:px,color:#000000, font-size:15px;
classDef white fill:#ffffff,stroke:#000,stroke-width:px,color:#000,font-weight:bold
classDef k8s fill:#326ce5,stroke:#fff,stroke-width:1px,color:#fff;
classDef spacewhite fill:#ffffff,stroke:#fff,stroke-width:0px,color:#000
class 1,2,3,3a,4,5,6 grey
class S,T spacewhite
class changes,changes2 white
It is helpful to name branches like [Purpose]/[ID]/[Title]
where Purpose is docs, feat, or fix and ID is the issue identifier (or xxx if there is no related issue).
If you need help choosing a branch, reach out on the Discord channel.
Create a new branch based on the branch identified in step 1. This example assumes the base
branch is upstream/main:
git checkout -b <my_new_branch> upstream/main
Make your changes using a text editor.
At any time, use the git status command to see what files you’ve changed.
Commit your changes
When you are ready to submit a pull request, commit your changes.
In your local repository, check which files you need to commit:
git status
Output is similar to:
On branch <my_new_branch>
Your branch is up to date with 'origin/<my_new_branch>'.

Changes not staged for commit:
(use "git add <file>..." to update what will be committed)
(use "git checkout -- <file>..." to discard changes in working directory)

modified:   content/en/docs/development/contribute/new-content/add-documentation.md

no changes added to commit (use "git add" and/or "git commit -a")
Add the files listed under Changes not staged for commit to the commit:
git add <your_file_name>
Repeat this for each file.
After adding all the files, create a commit:
git commit -m "Your commit message"
Do not use any GitHub Keywords
in your commit message. You can add those to the pull request
description later.
Push your local branch and its new commit to your remote fork:
git push origin <my_new_branch>
Preview your changes locally
It’s a good idea to preview your changes locally before pushing them or opening a pull request.
A preview lets you catch build errors or markdown formatting problems.
Install and use the hugo command on your computer:
If you have not updated your website repository, the website/themes/docsy directory is empty.
The site cannot build without a local copy of the theme. To update the website theme, run:
git submodule update --init --recursive --depth 1
In a terminal, go to your United Manufacturing Hub website repository and start the Hugo server:
cd <path_to_your_repo>/umh.docs.umh.app
hugo server --buildFuture
Alternatively, if you have installed GNU make and GNU awk:
cd <path_to_your_repo>
make serve
In a web browser, navigate to https://localhost:1313. Hugo watches the
changes and rebuilds the site as needed.
To stop the local Hugo instance, go back to the terminal and type Ctrl+C,
or close the terminal window.
Open a pull request from your fork to united-manufacturing-hub/umh.docs.umh.app
Figure 3 shows the steps to open a PR from your fork to the umh/umh.docs.umh.app. The details follow.
flowchart LR
subgraph first[ ]
direction TB
1[1. Go to umh/umh.docs.umh.app repository] --> 2[2. Select New Pull Request]
2 --> 3[3. Select compare across forks]
3 --> 4[4. Select your fork from head repository drop-down menu]
end
subgraph second [ ]
direction TB
5[5. Select your branch from the compare drop-down menu] --> 6[6. Select Create Pull Request]
6 --> 7[7. Add a description to your PR]
7 --> 8[8. Select Create pull request]
end
first --> second
classDef grey fill:#dddddd,stroke:#ffffff,stroke-width:px,color:#000000, font-size:15px;
classDef white fill:#ffffff,stroke:#000,stroke-width:px,color:#000,font-weight:bold
class 1,2,3,4,5,6,7,8 grey
class first,second white
From the head repository drop-down menu, select your fork.
From the compare drop-down menu, select your branch.
Select Create Pull Request.
Add a description for your pull request:
Title (50 characters or less): Summarize the intent of the change.
Description: Describe the change in more detail.
If there is a related GitHub issue, include Fixes #12345 or Closes #12345 in the
description. GitHub’s automation closes the mentioned issue after merging the PR if used.
If there are other related PRs, link those as well.
If you want advice on something specific, include any questions you’d like reviewers to
think about in your description.
Select the Create pull request button.
Congratulations! Your pull request is available in Pull requests.
After opening a PR, GitHub runs automated tests and tries to deploy a preview using
Cloudflare Pages.
If the Cloudflare Page build fails, select Details for more information.
If the Cloudflare Page build succeeds, select Details opens a staged version of the United Manufacturing Hub
website with your changes applied. This is how reviewers check your changes.
You should also add labels to your PR.
Addressing feedback locally
After making your changes, amend your previous commit:
git commit -a --amend
-a: commits all changes
--amend: amends the previous commit, rather than creating a new one
Update your commit message if needed.
Use git push origin <my_new_branch> to push your changes and re-run the Cloudflare tests.
If you use git commit -m instead of amending, you must squash your commits
before merging.
Changes from reviewers
Sometimes reviewers commit to your pull request. Before making any other changes, fetch those commits.
Fetch commits from your remote fork and rebase your working branch:
git fetch origin
git rebase origin/<your-branch-name>
After rebasing, force-push new changes to your fork:
If another contributor commits changes to the same file in another PR, it can create a merge
conflict. You must resolve all merge conflicts in your PR.
Update your fork and rebase your local branch:
git fetch origin
git rebase origin/<your-branch-name>
If your PR has multiple commits, you must squash them into a single commit before merging your PR.
You can check the number of commits on your PR’s Commits tab or by running the git log
command locally.
This topic assumes vim as the command line text editor.
Start an interactive rebase:
git rebase -i HEAD~<number_of_commits_in_branch>
Squashing commits is a form of rebasing. The -i switch tells git you want to rebase interactively.
HEAD~<number_of_commits_in_branch indicates how many commits to look at for the rebase.
Output is similar to:
pick d875112ca Original commit
pick 4fa167b80 Address feedback 1
pick 7d54e15ee Address feedback 2

# Rebase 3d18sf680..7d54e15ee onto 3d183f680 (3 commands)

...

# These lines can be re-ordered; they are executed from top to bottom.
The first section of the output lists the commits in the rebase. The second section lists the
options for each commit. Changing the word pick changes the status of the commit once the rebase
is complete.
For the purposes of rebasing, focus on squash and pick.
This squashes commits 4fa167b80 Address feedback 1 and 7d54e15ee Address feedback 2 into
d875112ca Original commit, leaving only d875112ca Original commit as a part of the timeline.
Save and exit your file.
Push your squashed commit:
git push --force-with-lease origin <branch_name>
10.1.2.4 - Suggesting content improvements
This page describes how to suggest improvements to the United Manufacturing Hub
project.
If you notice an issue with the United Manufacturing Hub or one of its components,
like the documentation, or have an idea for new content, then open an issue. All
you need is a GitHub account and a web browser.
In most cases, new work on the United Manufacturing Hub begins with an issue in
GitHub. UMH maintainers then review, categorize and tag issues as needed. Next,
you or another member of the United Manufacturing Hub community open a pull
request with changes to resolve the issue.
Opening an issue
If you want to suggest improvements to existing content or notice an error, then
open an issue.
There are multiple issue templates to choose from. Choose the one that best
describes your issue.
Fill out the issue template with as many details as you can. If you have a
specific suggestion for how to resolve the issue, include it in the issue
description.
Click Submit new issue.
After submitting, check in on your issue occasionally or turn on GitHub notifications.
Reviewers and other community members might ask questions before
they can take action on your issue.
How to file great issues
Keep the following in mind when filing an issue:
Provide a clear issue description. Describe what specifically is missing, out
of date, wrong, or needs improvement.
Explain the specific impact the issue has on users.
Limit the scope of a given issue to a reasonable unit of work. For problems
with a large scope, break them down into smaller issues. For example, “Fix the
security docs” is too broad, but “Add details to the ‘Restricting network access’
topic” is specific enough to be actionable.
Search the existing issues to see if there’s anything related or similar to the
new issue.
If the new issue relates to another issue or pull request, refer to it
either by its full URL or by the issue or pull request number prefixed
with a # character. For example, Introduced by #987654.
Follow the Code of Conduct.
Respect your fellow contributors. For example, “The docs are terrible” is not
helpful or polite feedback.
10.1.3 - United Manufacturing Hub
Learn how to contribute to the United Manufacturing Hub.
10.1.3.1 - Setup Local Environment
This document describes how to set up your local environment for contributing
to the United Manufacturing Hub.
The following instructions describe how to set up your local environment for
contributing to the United Manufacturing Hub.
You can use any text editor or IDE. However, we recommend using
JetBrains GoLand.
Requirements
The following tools are required to contribute to the United Manufacturing Hub.
Use the links to install the correct version for your operating system. We
recommend using a package manager where possible (for Windows, we recommend
using Chocolatey).
GNU C Compiler version 12 or later. The gcc
binaries must be in your PATH environment variable, and the go variable
CGO_ENABLED must be set to 1. You can check this by running
go env CGO_ENABLED in your terminal.
Other tools that are not required, but are recommended:
If you are not a member of the United Manufacturing Hub organization, you will
need to fork the repository to your own GitHub account. This is done by clicking
the Fork button in the top-right corner of the
united-manufacturing-hub/united-manufacturing-hub
repository page.
# Build the container imagesmake docker-build
# Push the container imagesmake docker-push
# Build and push the container imagesmake docker
You can pass the following variables to change the behavior of the make
targets:
CTR_REPO: The container repository to push the images to. Defaults to
ghcr.io/united-manufacturing-hub.
CTR_TAG: The tag to use for the container images. Defaults to latest.
CTR_IMG: Space-separated list of container images. Defaults to all the images
in the deployment directory.
Run a cluster locally
To run a local cluster, run:
# Create a cluster that runs the latest version of the United Manufacturing Hubmake cluster-install
# Create a cluster that runs the local version of the United Manufacturing Hubmake cluster-install CHART=./deployment/helm/united-manufacturing-hub
You can pass the following variables to change the behavior of the make
targets:
CLUSTER_NAME: The name of the cluster. Defaults to umh.
CHART: The Helm chart to use. Defaults to united-manufacturing-hub/united-manufacturing-hub.
VERSION: The version of the Helm chart to use. Default is empty, which
means the latest version.
VALUES_FILE: The Helm values file to use. Default is empty, which means
the default values.
Test
To run the unit tests, run:
make go-test-unit
To run e2e tests, run:
make helm-test-upgrade
# To run the upgrade test with datamake helm-test-upgrade-with-data
Other useful commands
# Display the help for the Makefilemake help# Pass the PRINT_HELP=y flag to make to print the help for each targetmake cluster-install PRINT_HELP=y
This document outlines a collection of guidelines, style suggestions, and tips
for writing code in the different programming languages used throughout the
Kubernetes project.
If reviewers ask questions about why the code is the way it is, that’s a sign that comments might be helpful.
Command-line flags should use dashes, not underscores
Naming
Please consider package name when selecting an interface name, and avoid redundancy. For example, storage.Interface is better than storage.StorageInterface.
Do not use uppercase characters, underscores, or dashes in package names.
Please consider parent directory name when choosing a package name. For example, pkg/controllers/autoscaler/foo.go should say package autoscaler not package autoscalercontroller.
Unless there’s a good reason, the package foo line should match the name of the directory in which the .go file exists.
Importers can use a different name if they need to disambiguate.
Locks should be called lock and should never be embedded (always lock sync.Mutex). When multiple locks are present, give each lock a distinct name following Go conventions: stateLock, mapLock etc.
Testing conventions
All new packages and most new significant functionality must come with unit tests.
Significant features should come with integration and/or end-to-end.
Do not expect an asynchronous thing to happen immediately—do not wait for one second and expect a pod to be running. Wait and retry instead.
Directory and file conventions
Avoid package sprawl. Find an appropriate subdirectory for new packages.
Libraries with no appropriate home belong in new package subdirectories of pkg/util.
Avoid general utility packages. Packages called “util” are suspect. Instead, derive a name that describes your desired function. For example, the utility functions dealing with waiting for operations are in the wait package and include functionality like Poll. The full name is wait.Poll.
All filenames should be lowercase.
Go source files and directories use underscores, not dashes.
Package directories should generally avoid using separators as much as possible. When package names are multiple words, they usually should be in nested subdirectories.
Document directories and filenames should use dashes rather than underscores.
Go code for normal third-party dependencies is managed using go modules.
10.1.3.3 - Automation Tools
This section contains the description of the automation tools used in the
United Manufacturing Hub project.
Automation tools are an essential part of the United Manufacturing Hub project.
They automate the building and testing of the project’s code, ensuring that it
remains of high quality and stays reliable.
We rely on GitHub Actions for running the pipelines, which are defined in the
.github/workflows directory of the project’s repository.
Here’s a brief overview of each workflow:
Build Docker Images
This pipeline builds and pushes all the Docker images for the project, tagging
them using the branch name or the git tag. This way there is always a tagged
version for the latest release of the UMH, as well as specific version for each
branch to use for testing.
It runs on push events only when relevant files have been changed, such as the
Dockerfiles or the source code.
GitGuardian Scan
This pipeline scans the code for security vulnerabilities, such as exposed secrets.
It runs on both push and pull request events.
Test Deployment
Small deployment test
(deactivated for now as they were flaky. will be replaced in the future with E2E tests)
This pipeline group verifies that the current changes can be successfully
installed and that data flows correctly. There are two pipelines: a “tiny”
version with the minimum amount of services needed to run the stack, and a “full”
version with as many services as possible.
Each pipeline has two jobs. The first job installs the stacks with the current
changes, and the second job tries to upgrade from the latest stable version
to the current changes.
A test is run in each workflow to verify that simulated data flows through MQTT,
NodeRed, Kafka, and TimescaleDB. In the full version, an additional test for
sensorconnect is run, using a mocked sensor to verify the data flow.
It runs on pull request events when the Helm configuration or the source code
changes.
Full E2E test
On every push to main and staging, an E2E test is executed. More information about this can be found on Github
10.1.3.4 - Release Process
This page describes how to release a new version of the United Manufacturing
Hub.
Releases are coordinated by the United Manufacturing Hub team. All the features
and bug fixes due for a release are tracked in the internal project board.
Once all the features and bug fixes for a release are ready and merged into the
staging branch, the release process can start.
Companion
This section is for internal use at UMH.
Testing
If a new version of the Companion is ready to be released, it must be tested
before it can be published. The testing process is done in the staging
environment.
The developer can push to the staging branch all the changes that needs to be
tested, including the new version definition in the Updater and in the
version.json file. They can then use the make docker_tag GIT_TAG=<semver-tag-to-be-released> command from the Companion directory to
build and push the image. After that, from the staging environment, they can
trigger the update process.
This process will not make the changes available to the user, but keep in mind
that the tagged version could still be accidentally used. Once the testing is
done, all the changes are pushed to main and the new release is published,
the image will be overwritten with the correct one.
Versions of any installed plugins, such as Benthos-UMH.
Initiate your document with an executive summary that encapsulates updates and changes across all platforms, including UMH and Companion.
Version Update Procedure
Navigate to the ManagementConsole repository and contribute a new .go file within the /updater/cmd/upgrades path. This file’s name must adhere to the semantic versioning convention of the update (e.g., 0.0.5.go).
This file should:
Implement the Version interface defined in upgrade_interface.go.
Include PreMigration and PostMigration functions. These functions should return another function that, when executed, returns nil unless specific migration tasks are necessary. This nested function structure allows for conditional execution of migration steps, as demonstrated in the PostMigration example below:
Specify any Kubernetes controllers (e.g., Statefulsets, Deployments) needing restart post-update in the GetPodControllers function. Usually you just need to restart the companion itself, so you can use:
Validate that all kubernetes objects referenced here, are designed to restart after terminating their Pod.
This is especially important for Jobs.
Inside the versions.go, ensure to add your version inside the buildVersionLinkedList function.
funcbuildVersionLinkedList() error {
var err error builderOnce.Do(func() {
zap.S().Infof("Building version list")
start := v0x0x1{}
versionLinkedList = &start
/*
Other previous versions
*/// Our new version
err = addVersion(&v0x0x5{})
if err != nil {
zap.S().Warnf("Failed to add 0.0.5 to version list: %s", err)
return }
zap.S().Infof("Build version list")
})
return err
}
Update the version.json in the frontend/static/version directory with the new image tag and incorporate the changelog derived from your initial documentation draft.
{
  "companion": {
    "versions": [
      {
        "semver": "0.0.1",
        "changelog": {
          "full": ["INTERNAL TESTING 0.0.1"],
          "short": "Bugfixes"
        },
        "requiresManualIntervention": false
      },

       // Other previous versions

       // Our new version
      {
        "semver": "0.0.5",
        "changelog": {
          "full": ["See 0.0.4"],
          "short": "This version is the same as 0.0.5 and is used for upgrade testing"
        },
        "requiresManualIntervention": false
      }
    ]
  }
}
Finalizing the Release
To finalize:
Submit a PR to the documentation repository to transition the release notes from draft to final.
Initiate a PR from the staging to the main branch within the ManagementConsole repository, ensuring to reference the documentation PR.
Confirm the success of all test suites.
Merge the code changes and formalize the release on GitHub, labeling it with the semantic version (e.g., 0.0.5, excluding any preceding v).
Merge the documentation PR to publicize the new version within the official documentation.
Checklist
Draft documentation in /docs/whatsnew with version details and summary.
Add new .go file for version update in /updater/cmd/upgrades.
Implement Version interface and necessary migration functions.
Update version.json with new image tag and changelog.
Submit PR to finalize documentation.
Create and merge PR in ManagementConsole repository, referencing documentation PR.
Validate tests and merge code changes.
Release new GitHub version without the v prefix.
Merge documentation PR to publish new version details.
Helm Chart
Prerelease
The prerelease process is used to test the release before it is published.
If bugs are found during the prerelease, they can be fixed and the release
process can be restarted. Once the prerelease is finished, the release can be
published.
Validate that all external docker images are correctly overwritten.
This is especially important if an external chart is updated.
The easiest way to do this is to run helm template and check the output.
Navigate to the deployment/helm-repo directory and run the following
commands:
All the new releases must be thoroughly tested before they can be published.
This includes specific tests for the new features and bug fixes, as well as
general tests for the whole stack.
General tests include, but are not limited to:
Deploy the stack with flatcar
Upgrade the stack from the previous version
Deploy the stack on Karbon 300 and test with real sensors
If any bugs are found during the testing phase, they must be fixed and pushed
to the prerelease branch. Multiple prerelease versions can be created if
necessary.
Release
Once all the tests have passed, the release can be published. Merge the
prerelease branch into staging and create a new release branch.
Create a release branch from staging:
git checkout main
git pull
git checkout -b <next-version>
Update the version and appVersion fields in the Chart.yaml file to the
next version:
version:<next-version>appVersion:<next-version>
Navigate to the deployment/helm-repo directory and run the following
commands:
Merge staging into main and create a new release from the tag on
GitHub.
10.1.4 - Documentation
Learn how to contribute to the United Manufacturing Hub documentation.
Welcome
Welcome to the United Manufacturing Hub documentation! We’re excited that you want
to contribute to the project.
The first place to start is the Getting Started With Contributing
page. It provides a high-level overview of the contribution process.
Once you’re familiar with the contribution process, you can prepare for your
first contribution by reading the documents in this section.
United Manufacturing Hub documentation contributors:
Improve existing content
Create new content
Translate the documentation
Manage and publish the documentation parts of the United Manufacturing Hub release cycle
Your first contribution
You can prepare for your first contribution by reviewing several steps beforehand.
The next figure outlines the steps nad the details to follow.
flowchart LR
subgraph second[First Contribution]
direction TB
S[ ] -.-
G[Review PRs from other UMH members] -->
A[Check umh.docs.umh.app issues list for good first PRs] --> B[Open a PR!!]
end
subgraph first[Suggested Prep]
direction TB
T[ ] -.-
D[Read contribution overview] -->E[Read UMH content and style guides]
E --> F[Learn about Hugo page content types and shortcodes]
end
first ----> second
classDef grey fill:#dddddd,stroke:#ffffff,stroke-width:px,color:#000000, font-size:15px;
classDef white fill:#ffffff,stroke:#000,stroke-width:px,color:#000,font-weight:bold
classDef spacewhite fill:#ffffff,stroke:#fff,stroke-width:0px,color:#000
class A,B,D,E,F,G grey
class S,T spacewhite
class first,second white
This document describes how to set up your local environment for contributing
to United Manufacturing Hub documentation website.
The following instructions describe how to set up your local environment for
contributing to United Manufacturing Hub documentation website.
You can use any text editor to contribute to the documentation. However, we
recommend using Visual Studio Code with the
Markdown All in One
extension. Additional extensions that can be useful are:
The following tools are required to contribute to the documentation website. Use
your preferred package manager to install them (for Windows users, we recommend
using Chocolatey).
If you are not a member of the United Manufacturing Hub organization, you will
need to fork the repository to your own GitHub account. This is done by clicking
the Fork button in the top-right corner of the
united-manufacturing-hub/umh.docs.umh.app
repository page.
Where <user> is your GitHub username, or united-manufacturing-hub if
you are a member of the United Manufacturing Hub organization.
If you are not a member of the United Manufacturing Hub organization, you will
need to add the upstream repository as a remote:
git remote add upstream https://github.com/united-manufacturing-hub/umh.docs.umh.app.git
# Never push to upstream mastergit remote set-url --push upstream no_push
Setup the environment
If you are running on a Windows system, manually install the above required tools.
If you are running on a Linux system, or can run a bash shell, you can use the
following commands to install the required tools:
cd <path_to_your_repo>
make install
Run the development server
Now it’s time to run the server locally.
Navigate to the umh.docs.umh.app directory inside the repository you cloned
earlier.
cd <path_to_your_repo>/umh.docs.umh.app
If you have not installed GNU make, run the following command:
hugo server --buildDrafts
Otherwise, run the following command:
make serve
Either method will start the local Hugo server on port 1313. Open up your browser to
http://localhost:1313 to view the website. As you make changes to the source
files, Hugo updates the website and forces a browser refresh.
You can stop the server by pressing Ctrl+C in the terminal.
This page shows how to create a new topic for the United Manufacturing Hub docs.
Choosing a page type
As you prepare to write a new topic, think about the page type that would fit
your content the best. We have many archetypes to choose from, and you can
create a new one if none of the existing ones fit your needs.
Generally, each archetype is specific to a particular type of content. For
example, the upgrading archetype is used for pages that describe how to
upgrade to a new version of United Manufacturing Hub, and most of the content
in the Production Guide section of the docs uses the tasks archetype.
In the content guide
you can find a description of the most used archetypes. If you need to create
a new archetype, you can find more information in the
Hugo documentation.
Choosing a directory
The directory in which you put your file is mostly determined by the page type
you choose.
If you think that your topic doesn’t belong to any of the existing sections,
you should first discuss with the United Manufacturing Hub team where your
topic should go. They will coordinate the creation of a new section if needed.
Choosing a title and filename
Choose a title that has the keywords you want search engines to find.
Create a filename that uses the words in your title separated by hyphens.
For example, the topic with title
Access Factoryinsight Outside the Cluster
has filename access-factoryinsight-outside-cluster.md. You don’t need to put
“united manufacturing hub” in the filename, because “umh” is already in the
URL for the topic, for example:
In your topic, put a title field in the
front matter.
The front matter is the YAML block that is between the
triple-dashed lines at the top of the page. Here’s an example:
---title:Access Factoryinsight Outside the Cluster---
Most of the archetypes automatically create the page title using the filename,
but always check that the title makes sense.
Creating a new page
Once you have chosen the archetype, the location, and the file name, you can
create a new page using the hugo new command. For example, to create a new page
using the tasks archetype, run the following command:
hugo new docs/production-guide/my-first-task.md -k tasks
Placing your topic in the table of contents
The table of contents is built dynamically using the directory structure of the
documentation source. The top-level directories under /content/en/docs/ create
top-level navigation, and subdirectories each have entries in the table of
contents.
Each subdirectory has a file _index.md, which represents the “home” page for
a given subdirectory’s content. The _index.md does not need a template. It
can contain overview content about the topics in the subdirectory.
Other files in a directory are sorted alphabetically by default. This is almost
never the best order. To control the relative sorting of topics in a
subdirectory, set the weight: front-matter key to an integer. Typically, we
use multiples of 10, to account for adding topics later. For instance, a topic
with weight 10 will come before one with weight 20.
You can hide a topic from the table of contents by setting toc_hide: true, and
you can hide the list of child pages at the botton of an _index.md file by
setting no_list: true.
Embedding code in your topic
If you want to include some code in your topic, you can embed the code in your
file directly using the markdown code block syntax. This is recommended for the
following cases (not an exhaustive list):
The code shows the output from a command such as
kubectl get deploy mydeployment -o json | jq '.status'.
The code is not generic enough for users to try out.
The code is an incomplete example because its purpose is to highlight a
portion of a larger file.
The code is not meant for users to try out due to other reasons.
Including code from another file
Another way to include code in your topic is to create a new, complete sample
file (or group of sample files) and then reference the sample from your topic.
Use this method to include sample YAML files when the sample is generic and
reusable, and you want the reader to try it out themselves.
When adding a new standalone sample file, such as a YAML file, place the code in
one of the <LANG>/examples/ subdirectories where <LANG> is the language for
the topic. In your topic file, use the codenew shortcode:
{{< codenew file="<RELPATH>/my-example-yaml>" >}}
where <RELPATH> is the path to the file to include, relative to the
examples directory. The following Hugo shortcode references a YAML
file located at /content/en/examples/pods/storage/gce-volume.yaml.
This section provides guidance on writing style, content formatting and
organization, and using Hugo customizations specific to UMH documentation.
The topics in this section provide guidance on writing style, content formatting
and organization, and using Hugo customizations specific to UMH
documentation.
10.1.4.3.1 - Content Guide
This page contains guidelines for the United Manufacturing Hub documentation.
In this guide, you’ll find guidelines regarding the content for the United
Manufacturing Hub documentation, that is what content is allowed and how to
organize it.
For information about the styling, follow the
style guide, and
for a quick guide to writing a new page, follow the
quick start guide.
What’s allowed
United Manufacturing Hub docs allow content for third-party projects only when:
Content documents software in the United Manufacturing Hub project
Content documents software that’s out of project but necessary for United
Manufacturing Hub to function
Sections
The United Manufacturing Hub documentation is organized into sections. Each
section contains a specific set of pages that are relevant to a user goal.
Get started
The Get started section contains information to help new
users get started with the United Manufacturing Hub. It’s the first section a
reader sees when visiting the website, and it guides users through the
installation process.
Features
The Features section contains information about the
capabilities of the United Manufacturing Hub. It’s a high-level overview of the
project’s features, and it’s intended for users who want to learn more about them
without diving into the technical details.
Data Model
The Data Model section contains information about the data
model of the United Manufacturing Hub. It’s intended for users who want to learn
more about the data model of the United Manufacturing Hub and how it’s used by
the different components of the project.
Architecture
The Architecture section contains technical information
about the United Manufacturing Hub. It’s intended for users who want to learn
more about the project’s architecture and design decisions. Here there are
information about the different components of the United Manufacturing Hub and
how they interact with each other.
Production Guide
The Production Guide section contains a series of
guides that help users to set up and operate the United Manufacturing Hub.
What’s New
The What’s New section contains high-level overview of all
the releases of the United Manufacturing Hub. Usually, only the last 3 to 4
releases are displayed in the sidebar, but all the releases are available in the
section page.
Reference
The Reference section contains technical information about
the different components of the United Manufacturing Hub. It’s intended for users
who want to learn more about the different components of the project and how
they work.
Development
The Development section contains information about
contributing to the United Manufacturing Hub project. It’s intended for users who
want to contribute to the project, either by writing code or documentation.
The documentation side menu, the documentation page browser etc. are listed
using Hugo’s default sort order, which sorts by weight (from 1), date (newest
first), and finally by the link title.
Given that, if you want to move a page or a section up, set a weight in the
page’s front matter:
title:My Pageweight:10
For page weights, it can be smart not to use 1, 2, 3 …, but some other interval,
say 10, 20, 30… This allows you to insert pages where you want later.
Additionally, each weight within the same directory (section) should not be
overlapped with the other weights. This makes sure that content is always organized
correctly, especially in localized content.
In some sections, like the What’s New section, it’s easier to manage the order
using a negative weight. This is because the What’s New section is organized by
release version, and the release version is a string, so it’s easier to use a
negative weight to sort the releases in the correct order.
Side Menu
The documentation side-bar menu is built from the current section tree starting
below docs/.
It will show all sections and their pages.
If you don’t want to list a section or page, set the toc_hide flag to true
in front matter:
toc_hide:true
When you navigate to a section that has content, the specific section or page
(e.g. _index.md) is shown. Else, the first page inside that section is shown.
Page Bundles
In addition to standalone content pages (Markdown files), Hugo supports
Page Bundles.
One example is Custom Hugo Shortcodes.
It is considered a leaf bundle. Everything below the directory, including the
index.md, will be part of the bundle. This also includes page-relative links,
images that can be processed etc.:
Another widely used example is the includes bundle. It sets headless: true
in front matter, which means that it does not get its own URL. It is only used
in other pages.
For translated bundles, any missing non-content files will be inherited from
languages above. This avoids duplication.
All the files in a bundle are what Hugo calls Resources and you can provide
metadata per language, such as parameters and title, even if it does not supports
front matter (YAML files etc.). See
Page Resources Metadata.
The value you get from .RelPermalink of a Resource is page-relative. See
Permalinks.
Page Content Types
Hugo uses archetypes to
define page types. The archetypes are located in the archetypes directory.
Each archetype informally defines its expected page structure. There are two main
archetypes, described below, but it’s possible to create new archetypes for
specific page types that are frequently used.
To create a new page using an archetype, run the following command:
hugo new -k <archetype> docs/<section>/<page-name>.md
Content Types
Concept
A concept page explains some aspect of United Manufacturing Hub. For example, a
concept page might describe a specific component of the United Manufacturing Hub
and explain the role it plays as an application while it is deployed, scaled,
and updated. Typically, concept pages don’t include sequences of steps, but
instead provide links to tasks or tutorials.
To write a new concept page, create a Markdown file with the following characteristics:
Concept pages are divided into three sections:
Page section
overview
body
whatsnext
The overview and body sections appear as comments in the concept page.
You can add the whatsnext section to your page with the heading shortcode.
Fill each section with content. Follow these guidelines:
Organize content with H2 and H3 headings.
For overview, set the topic’s context with a single paragraph.
For body, explain the concept.
For whatsnext, provide a bulleted list of topics (5 maximum) to learn more about the concept.
Task
A task page shows how to do a single thing. The idea is to give readers a sequence
of steps that they can actually do as they read the page. A task page can be short
or long, provided it stays focused on one area. In a task page, it is OK to blend
brief explanations with the steps to be performed, but if you need to provide a
lengthy explanation, you should do that in a concept topic. Related task and
concept topics should link to each other.
To write a new task page, create a Markdown file with the following characteristics:
Page section
overview
prerequisites
steps
discussion
whatsnext
The overview, steps, and discussion sections appear as comments in the task page.
You can add the prerequisites and whatsnext sections to your page
with the heading shortcode.
Within each section, write your content. Use the following guidelines:
Use a minimum of H2 headings (with two leading # characters). The sections
themselves are titled automatically by the template.
For overview, use a paragraph to set context for the entire topic.
For prerequisites, use bullet lists when possible. Start adding additional
prerequisites below the include. The default prerequisites include a running Kubernetes cluster.
For steps, use numbered lists.
For discussion, use normal content to expand upon the information covered
in steps.
For whatsnext, give a bullet list of up to 5 topics the reader might be
interested in reading next.
Each page content type contains a number of sections defined by
Markdown comments and HTML headings. You can add content headings to
your page with the heading shortcode. The comments and headings help
maintain the structure of the page content types.
Examples of Markdown comments defining page content sections:
<!-- overview --><!-- body -->
To create common headings in your content pages, use the heading shortcode with
a heading string.
Examples of heading strings:
whatsnext
prerequisites
objectives
cleanup
synopsis
seealso
options
For example, to create a whatsnext heading, add the heading shortcode with the “whatsnext” string:
## {{% heading "whatsnext" %}}
You can declare a prerequisites heading as follows:
## {{% heading "prerequisites" %}}
The heading shortcode expects one string parameter.
The heading string parameter matches the prefix of a variable in the i18n/<lang>.toml files.
For example:
This page gives writing style guidelines for the United Manufacturing Hub documentation.
This page gives writing style guidelines for the United Manufacturing Hub documentation.
These are guidelines, not rules. Use your best judgment, and feel free to
propose changes to this document in a pull request.
For additional information on creating new content for the United Manufacturing Hub
documentation, read the Documentation Content Guide.
Language
The United Manufacturing Hub documentation has not been translated yet. But if
you want to help with that, you can check out the localization page.
Documentation formatting standards
Use upper camel case for Kubernetes objects
When you refer specifically to interacting with a Kubernetes object, use
UpperCamelCase, also known as Pascal
case.
The following examples focus on capitalization. For more information about
formatting Kubernetes object names, review the related guidance on
Code Style.
Do and Don't - Use Pascal case for Kubernetes objects
Do
Don’t
The ConfigMap of …
The Config map of …
The Volume object contains a hostPath field.
The volume object contains a hostPath field.
Every ConfigMap object is part of a namespace.
Every configMap object is part of a namespace.
For managing confidential data, consider using a Secret.
For managing confidential data, consider using the a secret.
Use angle brackets for placeholders
Use angle brackets for placeholders. Tell the reader what a placeholder
represents, for example:
Display information about a pod:
kubectl describe pod <pod-name> -n <namespace>
Use bold for user interface elements
Do and Don't - Bold interface elements
Do
Don’t
Click Fork.
Click “Fork”.
Select Other.
Select “Other”.
Use italics to define or introduce new terms
Do and Don't - Use italics for new terms
Do
Don’t
A cluster is a set of nodes …
A “cluster” is a set of nodes …
These components form the control plane.
These components form the control plane.
Use code style for filenames, directories, and paths
Do and Don't - Use code style for filenames, directories, and paths
Do
Don’t
Open the envars.yaml file.
Open the envars.yaml file.
Go to the /docs/tutorials directory.
Go to the /docs/tutorials directory.
Open the /_data/concepts.yaml file.
Open the /_data/concepts.yaml file.
Use the international standard for punctuation inside quotes
Do and Don't - Use the international standard for punctuation inside quotes
Do
Don’t
events are recorded with an associated “stage”.
events are recorded with an associated “stage.”
The copy is called a “fork”.
The copy is called a “fork.”
Inline code formatting
Use code style for inline code, commands, and API objects
For inline code in an HTML document, use the <code> tag. In a Markdown
document, use the backtick (`).
Do and Don't - Use code style for inline code, commands, and API objects
Do
Don’t
The kubectl run command creates a Pod.
The “kubectl run” command creates a pod.
The kubelet on each node acquires a Lease…
The kubelet on each node acquires a lease…
A PersistentVolume represents durable storage…
A Persistent Volume represents durable storage…
For declarative management, use kubectl apply.
For declarative management, use “kubectl apply”.
Enclose code samples with triple backticks. (```)
Enclose code samples with any other syntax.
Use single backticks to enclose inline code. For example, var example = true.
Use two asterisks (**) or an underscore (_) to enclose inline code. For example, var example = true.
Use triple backticks before and after a multi-line block of code for fenced code blocks.
Use multi-line blocks of code to create diagrams, flowcharts, or other illustrations.
Use meaningful variable names that have a context.
Use variable names such as ‘foo’,‘bar’, and ‘baz’ that are not meaningful and lack context.
Remove trailing spaces in the code.
Add trailing spaces in the code, where these are important, because the screen reader will read out the spaces as well.
The website supports syntax highlighting for code samples, but specifying a language is optional. Syntax highlighting in the code block should conform to the contrast guidelines.
Use code style for object field names and namespaces
Do and Don't - Use code style for object field names
Do
Don’t
Set the value of the replicas field in the configuration file.
Set the value of the “replicas” field in the configuration file.
The value of the exec field is an ExecAction object.
The value of the “exec” field is an ExecAction object.
Run the process as a DaemonSet in the kube-system namespace.
Run the process as a DaemonSet in the kube-system namespace.
Use code style for command tools and component names
Do and Don't - Use code style for command tools and component names
Do
Don’t
The kubelet preserves node stability.
The kubelet preserves node stability.
The kubectl handles locating and authenticating to the API server.
The kubectl handles locating and authenticating to the apiserver.
Run the process with the certificate, kube-apiserver --client-ca-file=FILENAME.
Run the process with the certificate, kube-apiserver –client-ca-file=FILENAME.
Starting a sentence with a component tool or component name
Do and Don't - Starting a sentence with a component tool or component name
Do
Don’t
The kubeadm tool bootstraps and provisions machines in a cluster.
kubeadm tool bootstraps and provisions machines in a cluster.
The kube-scheduler is the default scheduler for United Manufacturing Hub.
kube-scheduler is the default scheduler for United Manufacturing Hub.
Use a general descriptor over a component name
Do and Don't - Use a general descriptor over a component name
Do
Don’t
The United Manufacturing Hub MQTT broker handles…
The HiveMQ handles…
To visualize data in the database…
To visualize data in TimescaleDB…
Use normal style for string and integer field values
For field values of type string or integer, use normal style without quotation marks.
Do and Don't - Use normal style for string and integer field values
Do
Don’t
Set the value of imagePullPolicy to Always.
Set the value of imagePullPolicy to “Always”.
Set the value of image to nginx:1.16.
Set the value of image to nginx:1.16.
Set the value of the replicas field to 2.
Set the value of the replicas field to 2.
Code snippet formatting
Don’t include the command prompt
Do and Don't - Don't include the command prompt
Do
Don’t
kubectl get pods
$ kubectl get pods
Separate commands from output
Verify that the pod is running on your chosen node:
kubectl get pods --output=wide
The output is similar to this:
NAME READY STATUS RESTARTS AGE IP NODE
nginx 1/1 Running 0 13s 10.200.0.4 worker0
Versioning United Manufacturing Hub examples
Code examples and configuration examples that include version information should be consistent with the accompanying text.
If the information is version specific, the United Manufacturing Hub version needs to be defined in the prerequisites section of the Task template or the Tutorial template. Once the page is saved, the prerequisites section is shown as Before you begin.
To specify the United Manufacturing Hub version for a task or tutorial page, include minimum-version in the front matter of the page.
If the example YAML is in a standalone file, find and review the topics that include it as a reference.
Verify that any topics using the standalone YAML have the appropriate version information defined.
If a stand-alone YAML file is not referenced from any topics, consider deleting it instead of updating it.
For example, if you are writing a tutorial that is relevant to United Manufacturing Hub version 0.9.11, the front-matter of your markdown file should look something like:
---title:<your tutorial title here>minimum-version:0.9.11---
In code and configuration examples, do not include comments about alternative versions.
Be careful to not include incorrect statements in your examples as comments, such as:
apiVersion:v1# earlier versions use...kind:Pod...
United Manufacturing Hub word list
A list of UMH-specific terms and words to be used consistently across the site.
United Manufacturing Hub.io word list
Term
Usage
United Manufacturing Hub
United Manufacturing Hub should always be capitalized.
Management Console
Management Console should always be capitalized.
Shortcodes
Hugo Shortcodes help create different rhetorical appeal levels.
There are multiple custom shortcodes that can be used in the United Manufacturing Hub documentation.
Refer to the shortcode guide for more information.
Markdown elements
Line breaks
Use a single newline to separate block-level content like headings, lists, images, code blocks, and others. The exception is second-level headings, where it should be two newlines. Second-level headings follow the first-level (or the title) without any preceding paragraphs or texts. A two line spacing helps visualize the overall structure of content in a code editor better.
Headings and titles
People accessing this documentation may use a screen reader or other assistive technology (AT). Screen readers are linear output devices, they output items on a page one at a time. If there is a lot of content on a page, you can use headings to give the page an internal structure. A good page structure helps all readers to easily navigate the page or filter topics of interest.
Do and Don't - Headings
Do
Don’t
Update the title in the front matter of the page or blog post.
Use first level heading, as Hugo automatically converts the title in the front matter of the page into a first-level heading.
Use ordered headings to provide a meaningful high-level outline of your content.
Use headings level 4 through 6, unless it is absolutely necessary. If your content is that detailed, it may need to be broken into separate articles.
Use pound or hash signs (#) for non-blog post content.
Use underlines (--- or ===) to designate first-level headings.
Use sentence case for headings in the page body. For example, Change the security context
Use title case for headings in the page body. For example, Change The Security Context
Use title case for the page title in the front matter. For example, title: Execute Kafka Shell Scripts
Use sentence case for page titles in the front matter. For example, don’t use title: Execute Kafka shell scripts
Paragraphs
Do and Don't - Paragraphs
Do
Don’t
Try to keep paragraphs under 6 sentences.
Indent the first paragraph with space characters. For example, ⋅⋅⋅Three spaces before a paragraph will indent it.
Use three hyphens (---) to create a horizontal rule. Use horizontal rules for breaks in paragraph content. For example, a change of scene in a story, or a shift of topic within a section.
Use horizontal rules for decoration.
Links
Do and Don't - Links
Do
Don’t
Write hyperlinks that give you context for the content they link to. For example: Certain ports are open on your machines. See Check required ports for more details.
Use ambiguous terms such as “click here”. For example: Certain ports are open on your machines. See here for more details.
Write Markdown-style links: [link text](/URL). For example: [Hugo shortcodes](/docs/development/contribute/documentation/style/hugo-shortcodes/#table-captions) and the output is Hugo shortcodes.
Write HTML-style links: <a href="/media/examples/link-element-example.css" target="_blank">Visit our tutorial!</a>, or create links that open in new tabs or windows. For example: [example website](https://example.com){target="_blank"}
Lists
Group items in a list that are related to each other and need to appear in a specific order or to indicate a correlation between multiple items. When a screen reader comes across a list—whether it is an ordered or unordered list—it will be announced to the user that there is a group of list items. The user can then use the arrow keys to move up and down between the various items in the list.
Website navigation links can also be marked up as list items; after all they are nothing but a group of related links.
End each item in a list with a period if one or more items in the list are complete sentences. For the sake of consistency, normally either all items or none should be complete sentences.
Ordered lists that are part of an incomplete introductory sentence can be in lowercase and punctuated as if each item was a part of the introductory sentence.
Use the number one (1.) for ordered lists.
Use (+), (*), or (-) for unordered lists.
Leave a blank line after each list.
Indent nested lists with four spaces (for example, ⋅⋅⋅⋅).
List items may consist of multiple paragraphs. Each subsequent paragraph in a list item must be indented by either four spaces or one tab.
Tables
The semantic purpose of a data table is to present tabular data. Sighted users can quickly scan the table but a screen reader goes through line by line. A table caption is used to create a descriptive title for a data table. Assistive technologies (AT) use the HTML table caption element to identify the table contents to the user within the page structure.
This section contains suggested best practices for clear, concise, and consistent content.
Use present tense
Do and Don't - Use present tense
Do
Don’t
This command starts a proxy.
This command will start a proxy.
Exception: Use future or past tense if it is required to convey the correct
meaning.
Use active voice
Do and Don't - Use active voice
Do
Don’t
You can explore the API using a browser.
The API can be explored using a browser.
The YAML file specifies the replica count.
The replica count is specified in the YAML file.
Exception: Use passive voice if active voice leads to an awkward construction.
Use simple and direct language
Use simple and direct language. Avoid using unnecessary phrases, such as saying “please.”
Do and Don't - Use simple and direct language
Do
Don’t
To create a ReplicaSet, …
In order to create a ReplicaSet, …
See the configuration file.
Please see the configuration file.
View the pods.
With this next command, we’ll view the pods.
Address the reader as “you”
Do and Don't - Addressing the reader
Do
Don’t
You can create a Deployment by …
We’ll create a Deployment by …
In the preceding output, you can see…
In the preceding output, we can see …
Avoid Latin phrases
Prefer English terms over Latin abbreviations.
Do and Don't - Avoid Latin phrases
Do
Don’t
For example, …
e.g., …
That is, …
i.e., …
Exception: Use “etc.” for et cetera.
Patterns to avoid
Avoid using “we”
Using “we” in a sentence can be confusing, because the reader might not know
whether they’re part of the “we” you’re describing.
Do and Don't - Patterns to avoid
Do
Don’t
Version 1.4 includes …
In version 1.4, we have added …
United Manufacturing Hub provides a new feature for …
We provide a new feature …
This page teaches you how to use pods.
In this page, we are going to learn about pods.
Avoid jargon and idioms
Some readers speak English as a second language. Avoid jargon and idioms to help them understand better.
Do and Don't - Avoid jargon and idioms
Do
Don’t
Internally, …
Under the hood, …
Create a new cluster.
Turn up a new cluster.
Avoid statements about the future
Avoid making promises or giving hints about the future. If you need to talk about
an alpha feature, put the text under a heading that identifies it as alpha
information.
An exception to this rule is documentation about announced deprecations
targeting removal in future versions.
Avoid statements that will soon be out of date
Avoid words like “currently” and “new.” A feature that is new today might not be
considered new in a few months.
Do and Don't - Avoid statements that will soon be out of date
Do
Don’t
In version 1.4, …
In the current version, …
The Federation feature provides …
The new Federation feature provides …
Avoid words that assume a specific level of understanding
Avoid words such as “just”, “simply”, “easy”, “easily”, or “simple”. These words do not add value.
This guide shows you how to create, edit and share diagrams using the Mermaid
JavaScript library.
This guide is taken from the Kubernets documentation, so there might be some
references to Kubernetes that are not relevant to United Manufacturing Hub.
This guide shows you how to create, edit and share diagrams using the Mermaid
JavaScript library. Mermaid.js allows you to generate diagrams using a simple
markdown-like syntax inside Markdown files. You can also use Mermaid to
generate .svg or .png image files that you can add to your documentation.
The target audience for this guide is anybody wishing to learn about Mermaid
and/or how to create and add diagrams to United Manufacturing Hub documentation.
Figure 1 outlines the topics covered in this section.
flowchart LR
subgraph m[Mermaid.js]
direction TB
S[ ]-.-
C[build diagrams with markdown] -->
D[on-line live editor]
end
A[Why are diagrams useful?] --> m
m --> N[3 x methods for creating diagrams]
N --> T[Examples]
T --> X[Styling and captions]
X --> V[Tips]
classDef box fill:#fff,stroke:#000,stroke-width:1px,color:#000;
classDef spacewhite fill:#ffffff,stroke:#fff,stroke-width:0px,color:#000
class A,C,D,N,X,m,T,V box
class S spacewhite
%% you can hyperlink Mermaid diagram nodes to a URL using click statements
click A "https://mermaid-js.github.io/mermaid-live-editor/edit/#eyJjb2RlIjoiZmxvd2NoYXJ0IExSXG4gICAgc3ViZ3JhcGggbVtNZXJtYWlkLmpzXVxuICAgIGRpcmVjdGlvbiBUQlxuICAgICAgICBTWyBdLS4tXG4gICAgICAgIENbYnVpbGQ8YnI-ZGlhZ3JhbXM8YnI-d2l0aCBtYXJrZG93bl0gLS0-XG4gICAgICAgIERbb24tbGluZTxicj5saXZlIGVkaXRvcl1cbiAgICBlbmRcbiAgICBBW1doeSBhcmUgZGlhZ3JhbXM8YnI-dXNlZnVsP10gLS0-IG1cbiAgICBtIC0tPiBOWzMgeCBtZXRob2RzPGJyPmZvciBjcmVhdGluZzxicj5kaWFncmFtc11cbiAgICBOIC0tPiBUW0V4YW1wbGVzXVxuICAgIFQgLS0-IFhbU3R5bGluZzxicj5hbmQ8YnI-Y2FwdGlvbnNdXG4gICAgWCAtLT4gVltUaXBzXVxuICAgIFxuIFxuICAgIGNsYXNzRGVmIGJveCBmaWxsOiNmZmYsc3Ryb2tlOiMwMDAsc3Ryb2tlLXdpZHRoOjFweCxjb2xvcjojMDAwO1xuICAgIGNsYXNzRGVmIHNwYWNld2hpdGUgZmlsbDojZmZmZmZmLHN0cm9rZTojZmZmLHN0cm9rZS13aWR0aDowcHgsY29sb3I6IzAwMFxuICAgIGNsYXNzIEEsQyxELE4sWCxtLFQsViBib3hcbiAgICBjbGFzcyBTIHNwYWNld2hpdGUiLCJtZXJtYWlkIjoie1xuICBcInRoZW1lXCI6IFwiZGVmYXVsdFwiXG59IiwidXBkYXRlRWRpdG9yIjpmYWxzZSwiYXV0b1N5bmMiOnRydWUsInVwZGF0ZURpYWdyYW0iOnRydWV9" _blank
click C "https://mermaid-js.github.io/mermaid-live-editor/edit/#eyJjb2RlIjoiZmxvd2NoYXJ0IExSXG4gICAgc3ViZ3JhcGggbVtNZXJtYWlkLmpzXVxuICAgIGRpcmVjdGlvbiBUQlxuICAgICAgICBTWyBdLS4tXG4gICAgICAgIENbYnVpbGQ8YnI-ZGlhZ3JhbXM8YnI-d2l0aCBtYXJrZG93bl0gLS0-XG4gICAgICAgIERbb24tbGluZTxicj5saXZlIGVkaXRvcl1cbiAgICBlbmRcbiAgICBBW1doeSBhcmUgZGlhZ3JhbXM8YnI-dXNlZnVsP10gLS0-IG1cbiAgICBtIC0tPiBOWzMgeCBtZXRob2RzPGJyPmZvciBjcmVhdGluZzxicj5kaWFncmFtc11cbiAgICBOIC0tPiBUW0V4YW1wbGVzXVxuICAgIFQgLS0-IFhbU3R5bGluZzxicj5hbmQ8YnI-Y2FwdGlvbnNdXG4gICAgWCAtLT4gVltUaXBzXVxuICAgIFxuIFxuICAgIGNsYXNzRGVmIGJveCBmaWxsOiNmZmYsc3Ryb2tlOiMwMDAsc3Ryb2tlLXdpZHRoOjFweCxjb2xvcjojMDAwO1xuICAgIGNsYXNzRGVmIHNwYWNld2hpdGUgZmlsbDojZmZmZmZmLHN0cm9rZTojZmZmLHN0cm9rZS13aWR0aDowcHgsY29sb3I6IzAwMFxuICAgIGNsYXNzIEEsQyxELE4sWCxtLFQsViBib3hcbiAgICBjbGFzcyBTIHNwYWNld2hpdGUiLCJtZXJtYWlkIjoie1xuICBcInRoZW1lXCI6IFwiZGVmYXVsdFwiXG59IiwidXBkYXRlRWRpdG9yIjpmYWxzZSwiYXV0b1N5bmMiOnRydWUsInVwZGF0ZURpYWdyYW0iOnRydWV9" _blank
click D "https://mermaid-js.github.io/mermaid-live-editor/edit/#eyJjb2RlIjoiZmxvd2NoYXJ0IExSXG4gICAgc3ViZ3JhcGggbVtNZXJtYWlkLmpzXVxuICAgIGRpcmVjdGlvbiBUQlxuICAgICAgICBTWyBdLS4tXG4gICAgICAgIENbYnVpbGQ8YnI-ZGlhZ3JhbXM8YnI-d2l0aCBtYXJrZG93bl0gLS0-XG4gICAgICAgIERbb24tbGluZTxicj5saXZlIGVkaXRvcl1cbiAgICBlbmRcbiAgICBBW1doeSBhcmUgZGlhZ3JhbXM8YnI-dXNlZnVsP10gLS0-IG1cbiAgICBtIC0tPiBOWzMgeCBtZXRob2RzPGJyPmZvciBjcmVhdGluZzxicj5kaWFncmFtc11cbiAgICBOIC0tPiBUW0V4YW1wbGVzXVxuICAgIFQgLS0-IFhbU3R5bGluZzxicj5hbmQ8YnI-Y2FwdGlvbnNdXG4gICAgWCAtLT4gVltUaXBzXVxuICAgIFxuIFxuICAgIGNsYXNzRGVmIGJveCBmaWxsOiNmZmYsc3Ryb2tlOiMwMDAsc3Ryb2tlLXdpZHRoOjFweCxjb2xvcjojMDAwO1xuICAgIGNsYXNzRGVmIHNwYWNld2hpdGUgZmlsbDojZmZmZmZmLHN0cm9rZTojZmZmLHN0cm9rZS13aWR0aDowcHgsY29sb3I6IzAwMFxuICAgIGNsYXNzIEEsQyxELE4sWCxtLFQsViBib3hcbiAgICBjbGFzcyBTIHNwYWNld2hpdGUiLCJtZXJtYWlkIjoie1xuICBcInRoZW1lXCI6IFwiZGVmYXVsdFwiXG59IiwidXBkYXRlRWRpdG9yIjpmYWxzZSwiYXV0b1N5bmMiOnRydWUsInVwZGF0ZURpYWdyYW0iOnRydWV9" _blank
click N "https://mermaid-js.github.io/mermaid-live-editor/edit/#eyJjb2RlIjoiZmxvd2NoYXJ0IExSXG4gICAgc3ViZ3JhcGggbVtNZXJtYWlkLmpzXVxuICAgIGRpcmVjdGlvbiBUQlxuICAgICAgICBTWyBdLS4tXG4gICAgICAgIENbYnVpbGQ8YnI-ZGlhZ3JhbXM8YnI-d2l0aCBtYXJrZG93bl0gLS0-XG4gICAgICAgIERbb24tbGluZTxicj5saXZlIGVkaXRvcl1cbiAgICBlbmRcbiAgICBBW1doeSBhcmUgZGlhZ3JhbXM8YnI-dXNlZnVsP10gLS0-IG1cbiAgICBtIC0tPiBOWzMgeCBtZXRob2RzPGJyPmZvciBjcmVhdGluZzxicj5kaWFncmFtc11cbiAgICBOIC0tPiBUW0V4YW1wbGVzXVxuICAgIFQgLS0-IFhbU3R5bGluZzxicj5hbmQ8YnI-Y2FwdGlvbnNdXG4gICAgWCAtLT4gVltUaXBzXVxuICAgIFxuIFxuICAgIGNsYXNzRGVmIGJveCBmaWxsOiNmZmYsc3Ryb2tlOiMwMDAsc3Ryb2tlLXdpZHRoOjFweCxjb2xvcjojMDAwO1xuICAgIGNsYXNzRGVmIHNwYWNld2hpdGUgZmlsbDojZmZmZmZmLHN0cm9rZTojZmZmLHN0cm9rZS13aWR0aDowcHgsY29sb3I6IzAwMFxuICAgIGNsYXNzIEEsQyxELE4sWCxtLFQsViBib3hcbiAgICBjbGFzcyBTIHNwYWNld2hpdGUiLCJtZXJtYWlkIjoie1xuICBcInRoZW1lXCI6IFwiZGVmYXVsdFwiXG59IiwidXBkYXRlRWRpdG9yIjpmYWxzZSwiYXV0b1N5bmMiOnRydWUsInVwZGF0ZURpYWdyYW0iOnRydWV9" _blank
click T "https://mermaid-js.github.io/mermaid-live-editor/edit/#eyJjb2RlIjoiZmxvd2NoYXJ0IExSXG4gICAgc3ViZ3JhcGggbVtNZXJtYWlkLmpzXVxuICAgIGRpcmVjdGlvbiBUQlxuICAgICAgICBTWyBdLS4tXG4gICAgICAgIENbYnVpbGQ8YnI-ZGlhZ3JhbXM8YnI-d2l0aCBtYXJrZG93bl0gLS0-XG4gICAgICAgIERbb24tbGluZTxicj5saXZlIGVkaXRvcl1cbiAgICBlbmRcbiAgICBBW1doeSBhcmUgZGlhZ3JhbXM8YnI-dXNlZnVsP10gLS0-IG1cbiAgICBtIC0tPiBOWzMgeCBtZXRob2RzPGJyPmZvciBjcmVhdGluZzxicj5kaWFncmFtc11cbiAgICBOIC0tPiBUW0V4YW1wbGVzXVxuICAgIFQgLS0-IFhbU3R5bGluZzxicj5hbmQ8YnI-Y2FwdGlvbnNdXG4gICAgWCAtLT4gVltUaXBzXVxuICAgIFxuIFxuICAgIGNsYXNzRGVmIGJveCBmaWxsOiNmZmYsc3Ryb2tlOiMwMDAsc3Ryb2tlLXdpZHRoOjFweCxjb2xvcjojMDAwO1xuICAgIGNsYXNzRGVmIHNwYWNld2hpdGUgZmlsbDojZmZmZmZmLHN0cm9rZTojZmZmLHN0cm9rZS13aWR0aDowcHgsY29sb3I6IzAwMFxuICAgIGNsYXNzIEEsQyxELE4sWCxtLFQsViBib3hcbiAgICBjbGFzcyBTIHNwYWNld2hpdGUiLCJtZXJtYWlkIjoie1xuICBcInRoZW1lXCI6IFwiZGVmYXVsdFwiXG59IiwidXBkYXRlRWRpdG9yIjpmYWxzZSwiYXV0b1N5bmMiOnRydWUsInVwZGF0ZURpYWdyYW0iOnRydWV9" _blank
click X "https://mermaid-js.github.io/mermaid-live-editor/edit/#eyJjb2RlIjoiZmxvd2NoYXJ0IExSXG4gICAgc3ViZ3JhcGggbVtNZXJtYWlkLmpzXVxuICAgIGRpcmVjdGlvbiBUQlxuICAgICAgICBTWyBdLS4tXG4gICAgICAgIENbYnVpbGQ8YnI-ZGlhZ3JhbXM8YnI-d2l0aCBtYXJrZG93bl0gLS0-XG4gICAgICAgIERbb24tbGluZTxicj5saXZlIGVkaXRvcl1cbiAgICBlbmRcbiAgICBBW1doeSBhcmUgZGlhZ3JhbXM8YnI-dXNlZnVsP10gLS0-IG1cbiAgICBtIC0tPiBOWzMgeCBtZXRob2RzPGJyPmZvciBjcmVhdGluZzxicj5kaWFncmFtc11cbiAgICBOIC0tPiBUW0V4YW1wbGVzXVxuICAgIFQgLS0-IFhbU3R5bGluZzxicj5hbmQ8YnI-Y2FwdGlvbnNdXG4gICAgWCAtLT4gVltUaXBzXVxuICAgIFxuIFxuICAgIGNsYXNzRGVmIGJveCBmaWxsOiNmZmYsc3Ryb2tlOiMwMDAsc3Ryb2tlLXdpZHRoOjFweCxjb2xvcjojMDAwO1xuICAgIGNsYXNzRGVmIHNwYWNld2hpdGUgZmlsbDojZmZmZmZmLHN0cm9rZTojZmZmLHN0cm9rZS13aWR0aDowcHgsY29sb3I6IzAwMFxuICAgIGNsYXNzIEEsQyxELE4sWCxtLFQsViBib3hcbiAgICBjbGFzcyBTIHNwYWNld2hpdGUiLCJtZXJtYWlkIjoie1xuICBcInRoZW1lXCI6IFwiZGVmYXVsdFwiXG59IiwidXBkYXRlRWRpdG9yIjpmYWxzZSwiYXV0b1N5bmMiOnRydWUsInVwZGF0ZURpYWdyYW0iOnRydWV9" _blank
click V "https://mermaid-js.github.io/mermaid-live-editor/edit/#eyJjb2RlIjoiZmxvd2NoYXJ0IExSXG4gICAgc3ViZ3JhcGggbVtNZXJtYWlkLmpzXVxuICAgIGRpcmVjdGlvbiBUQlxuICAgICAgICBTWyBdLS4tXG4gICAgICAgIENbYnVpbGQ8YnI-ZGlhZ3JhbXM8YnI-d2l0aCBtYXJrZG93bl0gLS0-XG4gICAgICAgIERbb24tbGluZTxicj5saXZlIGVkaXRvcl1cbiAgICBlbmRcbiAgICBBW1doeSBhcmUgZGlhZ3JhbXM8YnI-dXNlZnVsP10gLS0-IG1cbiAgICBtIC0tPiBOWzMgeCBtZXRob2RzPGJyPmZvciBjcmVhdGluZzxicj5kaWFncmFtc11cbiAgICBOIC0tPiBUW0V4YW1wbGVzXVxuICAgIFQgLS0-IFhbU3R5bGluZzxicj5hbmQ8YnI-Y2FwdGlvbnNdXG4gICAgWCAtLT4gVltUaXBzXVxuICAgIFxuIFxuICAgIGNsYXNzRGVmIGJveCBmaWxsOiNmZmYsc3Ryb2tlOiMwMDAsc3Ryb2tlLXdpZHRoOjFweCxjb2xvcjojMDAwO1xuICAgIGNsYXNzRGVmIHNwYWNld2hpdGUgZmlsbDojZmZmZmZmLHN0cm9rZTojZmZmLHN0cm9rZS13aWR0aDowcHgsY29sb3I6IzAwMFxuICAgIGNsYXNzIEEsQyxELE4sWCxtLFQsViBib3hcbiAgICBjbGFzcyBTIHNwYWNld2hpdGUiLCJtZXJtYWlkIjoie1xuICBcInRoZW1lXCI6IFwiZGVmYXVsdFwiXG59IiwidXBkYXRlRWRpdG9yIjpmYWxzZSwiYXV0b1N5bmMiOnRydWUsInVwZGF0ZURpYWdyYW0iOnRydWV9" _blank
You can click on each diagram in this section to view the code and rendered
diagram in the Mermaid live editor.
Why you should use diagrams in documentation
Diagrams improve documentation clarity and comprehension. There are advantages for both the user and the contributor.
The user benefits include:
Friendly landing spot. A detailed text-only greeting page could
intimidate users, in particular, first-time United Manufacturing Hub users.
Faster grasp of concepts. A diagram can help users understand the key
points of a complex topic. Your diagram can serve as a visual learning guide
to dive into the topic details.
Better retention. For some, it is easier to recall pictures rather than text.
The contributor benefits include:
Assist in developing the structure and content of your contribution. For
example, you can start with a simple diagram covering the high-level points
and then dive into details.
Expand and grow the user community. Easily consumed documentation
augmented with diagrams attracts new users who might previously have been
reluctant to engage due to perceived complexities.
You should consider your target audience. In addition to experienced UMH
users, you will have many who are new to United Manufacturing Hub. Even a simple diagram can
assist new users in absorbing United Manufacturing Hub concepts. They become emboldened and
more confident to further explore United Manufacturing Hub and the documentation.
Mermaid
Mermaid is an open source
JavaScript library that allows you to create, edit and easily share diagrams
using a simple, markdown-like syntax configured inline in Markdown files.
The following lists features of Mermaid:
Simple code syntax.
Includes a web-based tool allowing you to code and preview your diagrams.
Supports multiple formats including flowchart, state and sequence.
Easy collaboration with colleagues by sharing a per-diagram URL.
Broad selection of shapes, lines, themes and styling.
The following lists advantages of using Mermaid:
No need for separate, non-Mermaid diagram tools.
Adheres to existing PR workflow. You can think of Mermaid code as just
Markdown text included in your PR.
Simple tool builds simple diagrams. You don’t want to get bogged down
(re)crafting an overly complex and detailed picture. Keep it simple!
Mermaid provides a simple, open and transparent method for the SIG communities
to add, edit and collaborate on diagrams for new or existing documentation.
You can still use Mermaid to create/edit diagrams even if it’s not supported
in your environment. This method is called Mermaid+SVG and is explained
below.
Live editor
The Mermaid live editor is
a web-based tool that enables you to create, edit and review diagrams.
The following lists live editor functions:
Displays Mermaid code and rendered diagram.
Generates a URL for each saved diagram. The URL is displayed in the URL
field of your browser. You can share the URL with colleagues who can access
and modify the diagram.
Option to download .svg or .png files.
The live editor is the easiest and fastest way to create and edit Mermaid diagrams.
Methods for creating diagrams
Figure 2 outlines the three methods to generate and add diagrams.
graph TB
A[Contributor]
B[Inline
Mermaid code added to .md file]
C[Mermaid+SVG
Add mermaid-generated svg file to .md file]
D[External tool
Add external-tool- generated svg file to .md file]
A --> B
A --> C
A --> D
classDef box fill:#fff,stroke:#000,stroke-width:1px,color:#000;
class A,B,C,D box
%% you can hyperlink Mermaid diagram nodes to a URL using click statements
click A "https://mermaid-js.github.io/mermaid-live-editor/edit/#eyJjb2RlIjoiZ3JhcGggVEJcbiAgICBBW0NvbnRyaWJ1dG9yXVxuICAgIEJbSW5saW5lPGJyPjxicj5NZXJtYWlkIGNvZGU8YnI-YWRkZWQgdG8gLm1kIGZpbGVdXG4gICAgQ1tNZXJtYWlkK1NWRzxicj48YnI-QWRkIG1lcm1haWQtZ2VuZXJhdGVkPGJyPnN2ZyBmaWxlIHRvIC5tZCBmaWxlXVxuICAgIERbRXh0ZXJuYWwgdG9vbDxicj48YnI-QWRkIGV4dGVybmFsLXRvb2wtPGJyPmdlbmVyYXRlZCBzdmcgZmlsZTxicj50byAubWQgZmlsZV1cblxuICAgIEEgLS0-IEJcbiAgICBBIC0tPiBDXG4gICAgQSAtLT4gRFxuXG4gICAgY2xhc3NEZWYgYm94IGZpbGw6I2ZmZixzdHJva2U6IzAwMCxzdHJva2Utd2lkdGg6MXB4LGNvbG9yOiMwMDA7XG4gICAgY2xhc3MgQSxCLEMsRCBib3giLCJtZXJtYWlkIjoie1xuICBcInRoZW1lXCI6IFwiZGVmYXVsdFwiXG59IiwidXBkYXRlRWRpdG9yIjpmYWxzZSwiYXV0b1N5bmMiOnRydWUsInVwZGF0ZURpYWdyYW0iOmZhbHNlfQ" _blank
click B "https://mermaid-js.github.io/mermaid-live-editor/edit/#eyJjb2RlIjoiZ3JhcGggVEJcbiAgICBBW0NvbnRyaWJ1dG9yXVxuICAgIEJbSW5saW5lPGJyPjxicj5NZXJtYWlkIGNvZGU8YnI-YWRkZWQgdG8gLm1kIGZpbGVdXG4gICAgQ1tNZXJtYWlkK1NWRzxicj48YnI-QWRkIG1lcm1haWQtZ2VuZXJhdGVkPGJyPnN2ZyBmaWxlIHRvIC5tZCBmaWxlXVxuICAgIERbRXh0ZXJuYWwgdG9vbDxicj48YnI-QWRkIGV4dGVybmFsLXRvb2wtPGJyPmdlbmVyYXRlZCBzdmcgZmlsZTxicj50byAubWQgZmlsZV1cblxuICAgIEEgLS0-IEJcbiAgICBBIC0tPiBDXG4gICAgQSAtLT4gRFxuXG4gICAgY2xhc3NEZWYgYm94IGZpbGw6I2ZmZixzdHJva2U6IzAwMCxzdHJva2Utd2lkdGg6MXB4LGNvbG9yOiMwMDA7XG4gICAgY2xhc3MgQSxCLEMsRCBib3giLCJtZXJtYWlkIjoie1xuICBcInRoZW1lXCI6IFwiZGVmYXVsdFwiXG59IiwidXBkYXRlRWRpdG9yIjpmYWxzZSwiYXV0b1N5bmMiOnRydWUsInVwZGF0ZURpYWdyYW0iOmZhbHNlfQ" _blank
click C "https://mermaid-js.github.io/mermaid-live-editor/edit/#eyJjb2RlIjoiZ3JhcGggVEJcbiAgICBBW0NvbnRyaWJ1dG9yXVxuICAgIEJbSW5saW5lPGJyPjxicj5NZXJtYWlkIGNvZGU8YnI-YWRkZWQgdG8gLm1kIGZpbGVdXG4gICAgQ1tNZXJtYWlkK1NWRzxicj48YnI-QWRkIG1lcm1haWQtZ2VuZXJhdGVkPGJyPnN2ZyBmaWxlIHRvIC5tZCBmaWxlXVxuICAgIERbRXh0ZXJuYWwgdG9vbDxicj48YnI-QWRkIGV4dGVybmFsLXRvb2wtPGJyPmdlbmVyYXRlZCBzdmcgZmlsZTxicj50byAubWQgZmlsZV1cblxuICAgIEEgLS0-IEJcbiAgICBBIC0tPiBDXG4gICAgQSAtLT4gRFxuXG4gICAgY2xhc3NEZWYgYm94IGZpbGw6I2ZmZixzdHJva2U6IzAwMCxzdHJva2Utd2lkdGg6MXB4LGNvbG9yOiMwMDA7XG4gICAgY2xhc3MgQSxCLEMsRCBib3giLCJtZXJtYWlkIjoie1xuICBcInRoZW1lXCI6IFwiZGVmYXVsdFwiXG59IiwidXBkYXRlRWRpdG9yIjpmYWxzZSwiYXV0b1N5bmMiOnRydWUsInVwZGF0ZURpYWdyYW0iOmZhbHNlfQ" _blank
click D "https://mermaid-js.github.io/mermaid-live-editor/edit/#eyJjb2RlIjoiZ3JhcGggVEJcbiAgICBBW0NvbnRyaWJ1dG9yXVxuICAgIEJbSW5saW5lPGJyPjxicj5NZXJtYWlkIGNvZGU8YnI-YWRkZWQgdG8gLm1kIGZpbGVdXG4gICAgQ1tNZXJtYWlkK1NWRzxicj48YnI-QWRkIG1lcm1haWQtZ2VuZXJhdGVkPGJyPnN2ZyBmaWxlIHRvIC5tZCBmaWxlXVxuICAgIERbRXh0ZXJuYWwgdG9vbDxicj48YnI-QWRkIGV4dGVybmFsLXRvb2wtPGJyPmdlbmVyYXRlZCBzdmcgZmlsZTxicj50byAubWQgZmlsZV1cblxuICAgIEEgLS0-IEJcbiAgICBBIC0tPiBDXG4gICAgQSAtLT4gRFxuXG4gICAgY2xhc3NEZWYgYm94IGZpbGw6I2ZmZixzdHJva2U6IzAwMCxzdHJva2Utd2lkdGg6MXB4LGNvbG9yOiMwMDA7XG4gICAgY2xhc3MgQSxCLEMsRCBib3giLCJtZXJtYWlkIjoie1xuICBcInRoZW1lXCI6IFwiZGVmYXVsdFwiXG59IiwidXBkYXRlRWRpdG9yIjpmYWxzZSwiYXV0b1N5bmMiOnRydWUsInVwZGF0ZURpYWdyYW0iOmZhbHNlfQ" _blank
Figure 3 outlines the steps to follow for adding a diagram using the Inline
method.
graph LR
A[1. Use live editor to create/edit diagram] -->
B[2. Store diagram URL somewhere] -->
C[3. Copy Mermaid code to page markdown file] -->
D[4. Add caption]
classDef box fill:#fff,stroke:#000,stroke-width:1px,color:#000;
class A,B,C,D box
%% you can hyperlink Mermaid diagram nodes to a URL using click statements
click A "https://mermaid-js.github.io/mermaid-live-editor/edit/#eyJjb2RlIjoiZ3JhcGggTFJcbiAgICBBWzEuIFVzZSBsaXZlIGVkaXRvcjxicj4gdG8gY3JlYXRlL2VkaXQ8YnI-ZGlhZ3JhbV0gLS0-XG4gICAgQlsyLiBTdG9yZSBkaWFncmFtPGJyPlVSTCBzb21ld2hlcmVdIC0tPlxuICAgIENbMy4gQ29weSBNZXJtYWlkIGNvZGU8YnI-dG8gcGFnZSBtYXJrZG93biBmaWxlXSAtLT5cbiAgICBEWzQuIEFkZCBjYXB0aW9uXVxuIFxuXG4gICAgY2xhc3NEZWYgYm94IGZpbGw6I2ZmZixzdHJva2U6IzAwMCxzdHJva2Utd2lkdGg6MXB4LGNvbG9yOiMwMDA7XG4gICAgY2xhc3MgQSxCLEMsRCBib3hcbiAgICAiLCJtZXJtYWlkIjoie1xuICBcInRoZW1lXCI6IFwiZGVmYXVsdFwiXG59IiwidXBkYXRlRWRpdG9yIjpmYWxzZSwiYXV0b1N5bmMiOnRydWUsInVwZGF0ZURpYWdyYW0iOmZhbHNlfQ" _blank
click B "https://mermaid-js.github.io/mermaid-live-editor/edit/#eyJjb2RlIjoiZ3JhcGggTFJcbiAgICBBWzEuIFVzZSBsaXZlIGVkaXRvcjxicj4gdG8gY3JlYXRlL2VkaXQ8YnI-ZGlhZ3JhbV0gLS0-XG4gICAgQlsyLiBTdG9yZSBkaWFncmFtPGJyPlVSTCBzb21ld2hlcmVdIC0tPlxuICAgIENbMy4gQ29weSBNZXJtYWlkIGNvZGU8YnI-dG8gcGFnZSBtYXJrZG93biBmaWxlXSAtLT5cbiAgICBEWzQuIEFkZCBjYXB0aW9uXVxuIFxuXG4gICAgY2xhc3NEZWYgYm94IGZpbGw6I2ZmZixzdHJva2U6IzAwMCxzdHJva2Utd2lkdGg6MXB4LGNvbG9yOiMwMDA7XG4gICAgY2xhc3MgQSxCLEMsRCBib3hcbiAgICAiLCJtZXJtYWlkIjoie1xuICBcInRoZW1lXCI6IFwiZGVmYXVsdFwiXG59IiwidXBkYXRlRWRpdG9yIjpmYWxzZSwiYXV0b1N5bmMiOnRydWUsInVwZGF0ZURpYWdyYW0iOmZhbHNlfQ" _blank
click C "https://mermaid-js.github.io/mermaid-live-editor/edit/#eyJjb2RlIjoiZ3JhcGggTFJcbiAgICBBWzEuIFVzZSBsaXZlIGVkaXRvcjxicj4gdG8gY3JlYXRlL2VkaXQ8YnI-ZGlhZ3JhbV0gLS0-XG4gICAgQlsyLiBTdG9yZSBkaWFncmFtPGJyPlVSTCBzb21ld2hlcmVdIC0tPlxuICAgIENbMy4gQ29weSBNZXJtYWlkIGNvZGU8YnI-dG8gcGFnZSBtYXJrZG93biBmaWxlXSAtLT5cbiAgICBEWzQuIEFkZCBjYXB0aW9uXVxuIFxuXG4gICAgY2xhc3NEZWYgYm94IGZpbGw6I2ZmZixzdHJva2U6IzAwMCxzdHJva2Utd2lkdGg6MXB4LGNvbG9yOiMwMDA7XG4gICAgY2xhc3MgQSxCLEMsRCBib3hcbiAgICAiLCJtZXJtYWlkIjoie1xuICBcInRoZW1lXCI6IFwiZGVmYXVsdFwiXG59IiwidXBkYXRlRWRpdG9yIjpmYWxzZSwiYXV0b1N5bmMiOnRydWUsInVwZGF0ZURpYWdyYW0iOmZhbHNlfQ" _blank
click D "https://mermaid-js.github.io/mermaid-live-editor/edit/#eyJjb2RlIjoiZ3JhcGggTFJcbiAgICBBWzEuIFVzZSBsaXZlIGVkaXRvcjxicj4gdG8gY3JlYXRlL2VkaXQ8YnI-ZGlhZ3JhbV0gLS0-XG4gICAgQlsyLiBTdG9yZSBkaWFncmFtPGJyPlVSTCBzb21ld2hlcmVdIC0tPlxuICAgIENbMy4gQ29weSBNZXJtYWlkIGNvZGU8YnI-dG8gcGFnZSBtYXJrZG93biBmaWxlXSAtLT5cbiAgICBEWzQuIEFkZCBjYXB0aW9uXVxuIFxuXG4gICAgY2xhc3NEZWYgYm94IGZpbGw6I2ZmZixzdHJva2U6IzAwMCxzdHJva2Utd2lkdGg6MXB4LGNvbG9yOiMwMDA7XG4gICAgY2xhc3MgQSxCLEMsRCBib3hcbiAgICAiLCJtZXJtYWlkIjoie1xuICBcInRoZW1lXCI6IFwiZGVmYXVsdFwiXG59IiwidXBkYXRlRWRpdG9yIjpmYWxzZSwiYXV0b1N5bmMiOnRydWUsInVwZGF0ZURpYWdyYW0iOmZhbHNlfQ" _blank
The following lists the steps you should follow for adding a diagram using the Inline method:
Create your diagram using the live editor.
Store the diagram URL somewhere for later access.
Copy the mermaid code to the location in your .md file where you want the diagram to appear.
Add a caption below the diagram using Markdown text.
A Hugo build runs the Mermaid code and turns it into a diagram.
You may find keeping track of diagram URLs is cumbersome. If so, make a notice note
in the .md file that the Mermaid code is self-documenting. Contributors can
copy the Mermaid code to and from the live editor for diagram edits.
Here is a sample code snippet contained in an .md file:
---
title: My PR
---
Figure 17 shows a simple A to B process.
some markdown text
...
{{<mermaid>}} graph TB
A --> B
{{</mermaid>}}Figure 17. A to B
more text
You must include the Hugo Mermaid shortcode
tags at the start and end of the Mermaid code block. You should add a diagram
caption below the diagram.
The following lists advantages of the Inline method:
Live editor tool.
Easy to copy Mermaid code to and from the live editor and your .md file.
No need for separate .svg image file handling.
Content text, diagram code and diagram caption contained in the same .md file.
You should use the local
and Cloudflare previews to verify the diagram is properly rendered.
The Mermaid live editor feature set may not support the umh/umh.docd.umh.app Mermaid feature set.
You might see a syntax error or a blank screen after the Hugo build.
If that is the case, consider using the Mermaid+SVG method.
Mermaid+SVG
Figure 4 outlines the steps to follow for adding a diagram using the Mermaid+SVG method.
flowchart LR
A[1. Use live editor to create/edit diagram]
B[2. Store diagram URL somewhere]
C[3. Generate .svg file and download to images/ folder]
subgraph w[ ]
direction TB
D[4. Use figure shortcode to reference .svg file in page .md file] -->
E[5. Add caption]
end
A --> B
B --> C
C --> w
classDef box fill:#fff,stroke:#000,stroke-width:1px,color:#000;
class A,B,C,D,E,w box
click A "https://mermaid-js.github.io/mermaid-live-editor/edit/#eyJjb2RlIjoiZmxvd2NoYXJ0IExSXG4gICAgQVsxLiBVc2UgbGl2ZSBlZGl0b3I8YnI-IHRvIGNyZWF0ZS9lZGl0PGJyPmRpYWdyYW1dXG4gICAgQlsyLiBTdG9yZSBkaWFncmFtPGJyPlVSTCBzb21ld2hlcmVdXG4gICAgQ1szLiBHZW5lcmF0ZSAuc3ZnIGZpbGU8YnI-YW5kIGRvd25sb2FkIHRvPGJyPmltYWdlcy8gZm9sZGVyXVxuICAgIHN1YmdyYXBoIHdbIF1cbiAgICBkaXJlY3Rpb24gVEJcbiAgICBEWzQuIFVzZSBmaWd1cmUgc2hvcnRjb2RlPGJyPnRvIHJlZmVyZW5jZSAuc3ZnPGJyPmZpbGUgaW4gcGFnZTxicj4ubWQgZmlsZV0gLS0-XG4gICAgRVs1LiBBZGQgY2FwdGlvbl1cbiAgICBlbmRcbkEgLS0-IEJcbkIgLS0-IENcbkMgLS0-IHdcblxuICAgIGNsYXNzRGVmIGJveCBmaWxsOiNmZmYsc3Ryb2tlOiMwMDAsc3Ryb2tlLXdpZHRoOjFweCxjb2xvcjojMDAwO1xuICAgIGNsYXNzIEEsQixDLEQsRSx3IGJveFxuICAgICIsIm1lcm1haWQiOiJ7XG4gIFwidGhlbWVcIjogXCJkZWZhdWx0XCJcbn0iLCJ1cGRhdGVFZGl0b3IiOmZhbHNlLCJhdXRvU3luYyI6dHJ1ZSwidXBkYXRlRGlhZ3JhbSI6dHJ1ZX0" _blank
click B "https://mermaid-js.github.io/mermaid-live-editor/edit/#eyJjb2RlIjoiZmxvd2NoYXJ0IExSXG4gICAgQVsxLiBVc2UgbGl2ZSBlZGl0b3I8YnI-IHRvIGNyZWF0ZS9lZGl0PGJyPmRpYWdyYW1dXG4gICAgQlsyLiBTdG9yZSBkaWFncmFtPGJyPlVSTCBzb21ld2hlcmVdXG4gICAgQ1szLiBHZW5lcmF0ZSAuc3ZnIGZpbGU8YnI-YW5kIGRvd25sb2FkIHRvPGJyPmltYWdlcy8gZm9sZGVyXVxuICAgIHN1YmdyYXBoIHdbIF1cbiAgICBkaXJlY3Rpb24gVEJcbiAgICBEWzQuIFVzZSBmaWd1cmUgc2hvcnRjb2RlPGJyPnRvIHJlZmVyZW5jZSAuc3ZnPGJyPmZpbGUgaW4gcGFnZTxicj4ubWQgZmlsZV0gLS0-XG4gICAgRVs1LiBBZGQgY2FwdGlvbl1cbiAgICBlbmRcbkEgLS0-IEJcbkIgLS0-IENcbkMgLS0-IHdcblxuICAgIGNsYXNzRGVmIGJveCBmaWxsOiNmZmYsc3Ryb2tlOiMwMDAsc3Ryb2tlLXdpZHRoOjFweCxjb2xvcjojMDAwO1xuICAgIGNsYXNzIEEsQixDLEQsRSx3IGJveFxuICAgICIsIm1lcm1haWQiOiJ7XG4gIFwidGhlbWVcIjogXCJkZWZhdWx0XCJcbn0iLCJ1cGRhdGVFZGl0b3IiOmZhbHNlLCJhdXRvU3luYyI6dHJ1ZSwidXBkYXRlRGlhZ3JhbSI6dHJ1ZX0" _blank
click C "https://mermaid-js.github.io/mermaid-live-editor/edit/#eyJjb2RlIjoiZmxvd2NoYXJ0IExSXG4gICAgQVsxLiBVc2UgbGl2ZSBlZGl0b3I8YnI-IHRvIGNyZWF0ZS9lZGl0PGJyPmRpYWdyYW1dXG4gICAgQlsyLiBTdG9yZSBkaWFncmFtPGJyPlVSTCBzb21ld2hlcmVdXG4gICAgQ1szLiBHZW5lcmF0ZSAuc3ZnIGZpbGU8YnI-YW5kIGRvd25sb2FkIHRvPGJyPmltYWdlcy8gZm9sZGVyXVxuICAgIHN1YmdyYXBoIHdbIF1cbiAgICBkaXJlY3Rpb24gVEJcbiAgICBEWzQuIFVzZSBmaWd1cmUgc2hvcnRjb2RlPGJyPnRvIHJlZmVyZW5jZSAuc3ZnPGJyPmZpbGUgaW4gcGFnZTxicj4ubWQgZmlsZV0gLS0-XG4gICAgRVs1LiBBZGQgY2FwdGlvbl1cbiAgICBlbmRcbkEgLS0-IEJcbkIgLS0-IENcbkMgLS0-IHdcblxuICAgIGNsYXNzRGVmIGJveCBmaWxsOiNmZmYsc3Ryb2tlOiMwMDAsc3Ryb2tlLXdpZHRoOjFweCxjb2xvcjojMDAwO1xuICAgIGNsYXNzIEEsQixDLEQsRSx3IGJveFxuICAgICIsIm1lcm1haWQiOiJ7XG4gIFwidGhlbWVcIjogXCJkZWZhdWx0XCJcbn0iLCJ1cGRhdGVFZGl0b3IiOmZhbHNlLCJhdXRvU3luYyI6dHJ1ZSwidXBkYXRlRGlhZ3JhbSI6dHJ1ZX0" _blank
click D "https://mermaid-js.github.io/mermaid-live-editor/edit/#eyJjb2RlIjoiZmxvd2NoYXJ0IExSXG4gICAgQVsxLiBVc2UgbGl2ZSBlZGl0b3I8YnI-IHRvIGNyZWF0ZS9lZGl0PGJyPmRpYWdyYW1dXG4gICAgQlsyLiBTdG9yZSBkaWFncmFtPGJyPlVSTCBzb21ld2hlcmVdXG4gICAgQ1szLiBHZW5lcmF0ZSAuc3ZnIGZpbGU8YnI-YW5kIGRvd25sb2FkIHRvPGJyPmltYWdlcy8gZm9sZGVyXVxuICAgIHN1YmdyYXBoIHdbIF1cbiAgICBkaXJlY3Rpb24gVEJcbiAgICBEWzQuIFVzZSBmaWd1cmUgc2hvcnRjb2RlPGJyPnRvIHJlZmVyZW5jZSAuc3ZnPGJyPmZpbGUgaW4gcGFnZTxicj4ubWQgZmlsZV0gLS0-XG4gICAgRVs1LiBBZGQgY2FwdGlvbl1cbiAgICBlbmRcbkEgLS0-IEJcbkIgLS0-IENcbkMgLS0-IHdcblxuICAgIGNsYXNzRGVmIGJveCBmaWxsOiNmZmYsc3Ryb2tlOiMwMDAsc3Ryb2tlLXdpZHRoOjFweCxjb2xvcjojMDAwO1xuICAgIGNsYXNzIEEsQixDLEQsRSx3IGJveFxuICAgICIsIm1lcm1haWQiOiJ7XG4gIFwidGhlbWVcIjogXCJkZWZhdWx0XCJcbn0iLCJ1cGRhdGVFZGl0b3IiOmZhbHNlLCJhdXRvU3luYyI6dHJ1ZSwidXBkYXRlRGlhZ3JhbSI6dHJ1ZX0" _blank
click E "https://mermaid-js.github.io/mermaid-live-editor/edit/#eyJjb2RlIjoiZmxvd2NoYXJ0IExSXG4gICAgQVsxLiBVc2UgbGl2ZSBlZGl0b3I8YnI-IHRvIGNyZWF0ZS9lZGl0PGJyPmRpYWdyYW1dXG4gICAgQlsyLiBTdG9yZSBkaWFncmFtPGJyPlVSTCBzb21ld2hlcmVdXG4gICAgQ1szLiBHZW5lcmF0ZSAuc3ZnIGZpbGU8YnI-YW5kIGRvd25sb2FkIHRvPGJyPmltYWdlcy8gZm9sZGVyXVxuICAgIHN1YmdyYXBoIHdbIF1cbiAgICBkaXJlY3Rpb24gVEJcbiAgICBEWzQuIFVzZSBmaWd1cmUgc2hvcnRjb2RlPGJyPnRvIHJlZmVyZW5jZSAuc3ZnPGJyPmZpbGUgaW4gcGFnZTxicj4ubWQgZmlsZV0gLS0-XG4gICAgRVs1LiBBZGQgY2FwdGlvbl1cbiAgICBlbmRcbkEgLS0-IEJcbkIgLS0-IENcbkMgLS0-IHdcblxuICAgIGNsYXNzRGVmIGJveCBmaWxsOiNmZmYsc3Ryb2tlOiMwMDAsc3Ryb2tlLXdpZHRoOjFweCxjb2xvcjojMDAwO1xuICAgIGNsYXNzIEEsQixDLEQsRSx3IGJveFxuICAgICIsIm1lcm1haWQiOiJ7XG4gIFwidGhlbWVcIjogXCJkZWZhdWx0XCJcbn0iLCJ1cGRhdGVFZGl0b3IiOmZhbHNlLCJhdXRvU3luYyI6dHJ1ZSwidXBkYXRlRGlhZ3JhbSI6dHJ1ZX0" _blank
The following lists the steps you should follow for adding a diagram using the Mermaid+SVG method:
Create your diagram using the live editor.
Store the diagram URL somewhere for later access.
Generate an .svg image file for the diagram and download it to the appropriate images/ folder.
Use the {{< figure >}} shortcode to reference the diagram in the .md file.
Add a caption using the {{< figure >}} shortcode’s caption parameter.
For example, use the live editor to create a diagram called boxnet.
Store the diagram URL somewhere for later access. Generate and download a
boxnet.svg file to the appropriate ../images/ folder.
Use the {{< figure >}} shortcode in your PR’s .md file to reference
the .svg image file and add a caption.
The {{< figure >}} shortcode is the preferred method for adding .svg image files
to your documentation. You can also use the standard markdown image syntax like so:
.
And you will need to add a caption below the diagram.
You should add the live editor URL as a comment block in the .svg image file using a text editor.
For example, you would include the following at the beginning of the .svg image file:
<!-- To view or edit the mermaid code, use the following URL: --><!-- https://mermaid-js.github.io/mermaid-live-editor/edit/#eyJjb ... <remainder of the URL> -->
The following lists advantages of the Mermaid+SVG method:
Live editor tool.
Live editor tool supports the most current Mermaid feature set.
Employ existing umh/website methods for handling .svg image files.
Environment doesn’t require Mermaid support.
Be sure to check that your diagram renders properly using the
local
and Netlify previews.
External tool
Figure 5 outlines the steps to follow for adding a diagram using the External Tool method.
First, use your external tool to create the diagram and save it as an .svg
or .png image file. After that, use the same steps as the Mermaid+SVG
method for adding .svg image files.
flowchart LR
A[1. Use external tool to create/edit diagram]
B[2. If possible, save diagram coordinates for contributor access]
C[3. Generate .svg or.png file and download to appropriate images/ folder]
subgraph w[ ]
direction TB
D[4. Use figure shortcode to reference svg or png file in page .md file] -->
E[5. Add caption]
end
A --> B
B --> C
C --> w
classDef box fill:#fff,stroke:#000,stroke-width:1px,color:#000;
class A,B,C,D,E,w box
click A "https://mermaid-js.github.io/mermaid-live-editor/edit/#eyJjb2RlIjoiZmxvd2NoYXJ0IExSXG4gICAgQVsxLiBVc2UgZXh0ZXJuYWw8YnI-dG9vbCB0byBjcmVhdGUvZWRpdDxicj5kaWFncmFtXVxuICAgIEJbMi4gSWYgcG9zc2libGUsIHNhdmU8YnI-ZGlhZ3JhbSBjb29yZGluYXRlczxicj5mb3IgY29udHJpYnV0b3I8YnI-YWNjZXNzXVxuICAgIENbMy4gR2VuZXJhdGUgLnN2ZyA8YnI-b3IucG5nIGZpbGU8YnI-YW5kIGRvd25sb2FkIHRvPGJyPmFwcHJvcHJpYXRlPGJyPmltYWdlcy8gZm9sZGVyXVxuICAgIHN1YmdyYXBoIHdbIF1cbiAgICBkaXJlY3Rpb24gVEJcbiAgICBEWzQuIFVzZSBmaWd1cmUgc2hvcnRjb2RlPGJyPnRvIHJlZmVyZW5jZSBzdmcgb3I8YnI-cG5nIGZpbGUgaW48YnI-cGFnZSAubWQgZmlsZV0gLS0-XG4gICAgRVs1LiBBZGQgY2FwdGlvbl1cbiAgICBlbmRcbiAgICBBIC0tPiBCXG4gICAgQiAtLT4gQ1xuICAgIEMgLS0-IHdcbiAgICBjbGFzc0RlZiBib3ggZmlsbDojZmZmLHN0cm9rZTojMDAwLHN0cm9rZS13aWR0aDoxcHgsY29sb3I6IzAwMDtcbiAgICBjbGFzcyBBLEIsQyxELEUsdyBib3hcbiAgICAiLCJtZXJtYWlkIjoie1xuICBcInRoZW1lXCI6IFwiZGVmYXVsdFwiXG59IiwidXBkYXRlRWRpdG9yIjpmYWxzZSwiYXV0b1N5bmMiOnRydWUsInVwZGF0ZURpYWdyYW0iOmZhbHNlfQ"
click B "https://mermaid-js.github.io/mermaid-live-editor/edit/#eyJjb2RlIjoiZmxvd2NoYXJ0IExSXG4gICAgQVsxLiBVc2UgZXh0ZXJuYWw8YnI-dG9vbCB0byBjcmVhdGUvZWRpdDxicj5kaWFncmFtXVxuICAgIEJbMi4gSWYgcG9zc2libGUsIHNhdmU8YnI-ZGlhZ3JhbSBjb29yZGluYXRlczxicj5mb3IgY29udHJpYnV0b3I8YnI-YWNjZXNzXVxuICAgIENbMy4gR2VuZXJhdGUgLnN2ZyA8YnI-b3IucG5nIGZpbGU8YnI-YW5kIGRvd25sb2FkIHRvPGJyPmFwcHJvcHJpYXRlPGJyPmltYWdlcy8gZm9sZGVyXVxuICAgIHN1YmdyYXBoIHdbIF1cbiAgICBkaXJlY3Rpb24gVEJcbiAgICBEWzQuIFVzZSBmaWd1cmUgc2hvcnRjb2RlPGJyPnRvIHJlZmVyZW5jZSBzdmcgb3I8YnI-cG5nIGZpbGUgaW48YnI-cGFnZSAubWQgZmlsZV0gLS0-XG4gICAgRVs1LiBBZGQgY2FwdGlvbl1cbiAgICBlbmRcbiAgICBBIC0tPiBCXG4gICAgQiAtLT4gQ1xuICAgIEMgLS0-IHdcbiAgICBjbGFzc0RlZiBib3ggZmlsbDojZmZmLHN0cm9rZTojMDAwLHN0cm9rZS13aWR0aDoxcHgsY29sb3I6IzAwMDtcbiAgICBjbGFzcyBBLEIsQyxELEUsdyBib3hcbiAgICAiLCJtZXJtYWlkIjoie1xuICBcInRoZW1lXCI6IFwiZGVmYXVsdFwiXG59IiwidXBkYXRlRWRpdG9yIjpmYWxzZSwiYXV0b1N5bmMiOnRydWUsInVwZGF0ZURpYWdyYW0iOmZhbHNlfQ"
click C "https://mermaid-js.github.io/mermaid-live-editor/edit/#eyJjb2RlIjoiZmxvd2NoYXJ0IExSXG4gICAgQVsxLiBVc2UgZXh0ZXJuYWw8YnI-dG9vbCB0byBjcmVhdGUvZWRpdDxicj5kaWFncmFtXVxuICAgIEJbMi4gSWYgcG9zc2libGUsIHNhdmU8YnI-ZGlhZ3JhbSBjb29yZGluYXRlczxicj5mb3IgY29udHJpYnV0b3I8YnI-YWNjZXNzXVxuICAgIENbMy4gR2VuZXJhdGUgLnN2ZyA8YnI-b3IucG5nIGZpbGU8YnI-YW5kIGRvd25sb2FkIHRvPGJyPmFwcHJvcHJpYXRlPGJyPmltYWdlcy8gZm9sZGVyXVxuICAgIHN1YmdyYXBoIHdbIF1cbiAgICBkaXJlY3Rpb24gVEJcbiAgICBEWzQuIFVzZSBmaWd1cmUgc2hvcnRjb2RlPGJyPnRvIHJlZmVyZW5jZSBzdmcgb3I8YnI-cG5nIGZpbGUgaW48YnI-cGFnZSAubWQgZmlsZV0gLS0-XG4gICAgRVs1LiBBZGQgY2FwdGlvbl1cbiAgICBlbmRcbiAgICBBIC0tPiBCXG4gICAgQiAtLT4gQ1xuICAgIEMgLS0-IHdcbiAgICBjbGFzc0RlZiBib3ggZmlsbDojZmZmLHN0cm9rZTojMDAwLHN0cm9rZS13aWR0aDoxcHgsY29sb3I6IzAwMDtcbiAgICBjbGFzcyBBLEIsQyxELEUsdyBib3hcbiAgICAiLCJtZXJtYWlkIjoie1xuICBcInRoZW1lXCI6IFwiZGVmYXVsdFwiXG59IiwidXBkYXRlRWRpdG9yIjpmYWxzZSwiYXV0b1N5bmMiOnRydWUsInVwZGF0ZURpYWdyYW0iOmZhbHNlfQ"
click D "https://mermaid-js.github.io/mermaid-live-editor/edit/#eyJjb2RlIjoiZmxvd2NoYXJ0IExSXG4gICAgQVsxLiBVc2UgZXh0ZXJuYWw8YnI-dG9vbCB0byBjcmVhdGUvZWRpdDxicj5kaWFncmFtXVxuICAgIEJbMi4gSWYgcG9zc2libGUsIHNhdmU8YnI-ZGlhZ3JhbSBjb29yZGluYXRlczxicj5mb3IgY29udHJpYnV0b3I8YnI-YWNjZXNzXVxuICAgIENbMy4gR2VuZXJhdGUgLnN2ZyA8YnI-b3IucG5nIGZpbGU8YnI-YW5kIGRvd25sb2FkIHRvPGJyPmFwcHJvcHJpYXRlPGJyPmltYWdlcy8gZm9sZGVyXVxuICAgIHN1YmdyYXBoIHdbIF1cbiAgICBkaXJlY3Rpb24gVEJcbiAgICBEWzQuIFVzZSBmaWd1cmUgc2hvcnRjb2RlPGJyPnRvIHJlZmVyZW5jZSBzdmcgb3I8YnI-cG5nIGZpbGUgaW48YnI-cGFnZSAubWQgZmlsZV0gLS0-XG4gICAgRVs1LiBBZGQgY2FwdGlvbl1cbiAgICBlbmRcbiAgICBBIC0tPiBCXG4gICAgQiAtLT4gQ1xuICAgIEMgLS0-IHdcbiAgICBjbGFzc0RlZiBib3ggZmlsbDojZmZmLHN0cm9rZTojMDAwLHN0cm9rZS13aWR0aDoxcHgsY29sb3I6IzAwMDtcbiAgICBjbGFzcyBBLEIsQyxELEUsdyBib3hcbiAgICAiLCJtZXJtYWlkIjoie1xuICBcInRoZW1lXCI6IFwiZGVmYXVsdFwiXG59IiwidXBkYXRlRWRpdG9yIjpmYWxzZSwiYXV0b1N5bmMiOnRydWUsInVwZGF0ZURpYWdyYW0iOmZhbHNlfQ"
click E "https://mermaid-js.github.io/mermaid-live-editor/edit/#eyJjb2RlIjoiZmxvd2NoYXJ0IExSXG4gICAgQVsxLiBVc2UgZXh0ZXJuYWw8YnI-dG9vbCB0byBjcmVhdGUvZWRpdDxicj5kaWFncmFtXVxuICAgIEJbMi4gSWYgcG9zc2libGUsIHNhdmU8YnI-ZGlhZ3JhbSBjb29yZGluYXRlczxicj5mb3IgY29udHJpYnV0b3I8YnI-YWNjZXNzXVxuICAgIENbMy4gR2VuZXJhdGUgLnN2ZyA8YnI-b3IucG5nIGZpbGU8YnI-YW5kIGRvd25sb2FkIHRvPGJyPmFwcHJvcHJpYXRlPGJyPmltYWdlcy8gZm9sZGVyXVxuICAgIHN1YmdyYXBoIHdbIF1cbiAgICBkaXJlY3Rpb24gVEJcbiAgICBEWzQuIFVzZSBmaWd1cmUgc2hvcnRjb2RlPGJyPnRvIHJlZmVyZW5jZSBzdmcgb3I8YnI-cG5nIGZpbGUgaW48YnI-cGFnZSAubWQgZmlsZV0gLS0-XG4gICAgRVs1LiBBZGQgY2FwdGlvbl1cbiAgICBlbmRcbiAgICBBIC0tPiBCXG4gICAgQiAtLT4gQ1xuICAgIEMgLS0-IHdcbiAgICBjbGFzc0RlZiBib3ggZmlsbDojZmZmLHN0cm9rZTojMDAwLHN0cm9rZS13aWR0aDoxcHgsY29sb3I6IzAwMDtcbiAgICBjbGFzcyBBLEIsQyxELEUsdyBib3hcbiAgICAiLCJtZXJtYWlkIjoie1xuICBcInRoZW1lXCI6IFwiZGVmYXVsdFwiXG59IiwidXBkYXRlRWRpdG9yIjpmYWxzZSwiYXV0b1N5bmMiOnRydWUsInVwZGF0ZURpYWdyYW0iOmZhbHNlfQ"
The following lists the steps you should follow for adding a diagram using the External Tool method:
Use your external tool to create a diagram.
Save the diagram coordinates for contributor access. For example, your tool
may offer a link to the diagram image, or you could place the source code
file, such as an .xml file, in a public repository for later contributor access.
Generate and save the diagram as an .svg or .png image file.
Download this file to the appropriate ../images/ folder.
Use the {{< figure >}} shortcode to reference the diagram in the .md file.
Add a caption using the {{< figure >}} shortcode’s caption parameter.
Here is the {{< figure >}} shortcode for the images/apple.svg diagram:
{{< figure src="/static/images/apple.svg" alt="red-apple-figure" class="diagram-large" caption="Figure 9. A Big Red Apple" >}}
If your external drawing tool permits:
You can incorporate multiple .svg or .png logos, icons and images into your diagram.
However, make sure you observe copyright and follow the United Manufacturing Hub documentation
guidelines on the use of third party content.
You should save the diagram source coordinates for later contributor access.
For example, your tool may offer a link to the diagram image, or you could
place the source code file, such as an .xml file, somewhere for contributor access.
The following lists advantages of the External Tool method:
Contributor familiarity with external tool.
Diagrams require more detail than what Mermaid can offer.
Don’t forget to check that your diagram renders correctly using the
local and Netlify previews.
Examples
This section shows several examples of Mermaid diagrams.
The code block examples omit the Hugo Mermaid
shortcode tags. This allows you to copy the code block into the live editor
to experiment on your own.
notice note that the live editor doesn't recognize Hugo shortcodes.
Example 1 - Pod topology spread constraints
Figure 6 shows the diagram appearing in the Pod topology spread constraints page.
graph LR;
client([client])-. Ingress-managed <br> load balancer .->ingress[Ingress];
ingress-->|routing rule|service[Service];
subgraph cluster
ingress;
service-->pod1[Pod];
service-->pod2[Pod];
end
classDef plain fill:#ddd,stroke:#fff,stroke-width:4px,color:#000;
classDef k8s fill:#326ce5,stroke:#fff,stroke-width:4px,color:#fff;
classDef cluster fill:#fff,stroke:#bbb,stroke-width:2px,color:#326ce5;
class ingress,service,pod1,pod2 k8s;
class client plain;
class cluster cluster;
Example 3 - umh system flow WIP
Figure 8 depicts a Mermaid sequence diagram showing the system flow between
umh components to start a container.
Code block:
%%{init:{"theme":"neutral"}}%%
sequenceDiagram
actor me
participant apiSrv as control plane<br><br>api-server
participant etcd as control plane<br><br>etcd datastore
participant cntrlMgr as control plane<br><br>controller<br>manager
participant sched as control plane<br><br>scheduler
participant kubelet as node<br><br>kubelet
participant container as node<br><br>container<br>runtime
me->>apiSrv: 1. kubectl create -f pod.yaml
apiSrv-->>etcd: 2. save new state
cntrlMgr->>apiSrv: 3. check for changes
sched->>apiSrv: 4. watch for unassigned pods(s)
apiSrv->>sched: 5. notify about pod w nodename=" "
sched->>apiSrv: 6. assign pod to node
apiSrv-->>etcd: 7. save new state
kubelet->>apiSrv: 8. look for newly assigned pod(s)
apiSrv->>kubelet: 9. bind pod to node
kubelet->>container: 10. start container
kubelet->>apiSrv: 11. update pod status
apiSrv-->>etcd: 12. save new state
How to style diagrams
You can style one or more diagram elements using well-known CSS nomenclature.
You accomplish this using two types of statements in the Mermaid code.
classDef defines a class of style attributes.
class defines one or more elements to apply the class to.
In the code for
figure 7,
you can see examples of both.
classDef k8s fill:#326ce5,stroke:#fff,stroke-width:4px,color:#fff; // defines style for the k8s class
class ingress,service,pod1,pod2 k8s; // k8s class is applied to elements ingress, service, pod1 and pod2.
You can include one or multiple classDef and class statements in your diagram.
A caption is a brief description of a diagram. A title or a short description
of the diagram are examples of captions. Captions aren’t meant to replace
explanatory text you have in your documentation. Rather, they serve as a
“context link” between that text and your diagram.
The combination of some text and a diagram tied together with a caption help
provide a concise representation of the information you wish to convey to the
user.
Without captions, you are asking the user to scan the text above or below the
diagram to figure out a meaning. This can be frustrating for the user.
Figure 9 lays out the three components for proper captioning: diagram, diagram
caption and the diagram referral.
flowchart
A[Diagram
Inline Mermaid or SVG image files]
B[Diagram Caption
Add Figure Number. and Caption Text]
C[Diagram Referral
Referenence Figure Number in text]
classDef box fill:#fff,stroke:#000,stroke-width:1px,color:#000;
class A,B,C box
click A "https://mermaid-js.github.io/mermaid-live-editor/edit#eyJjb2RlIjoiZmxvd2NoYXJ0XG4gICAgQVtEaWFncmFtPGJyPjxicj5JbmxpbmUgTWVybWFpZCBvcjxicj5TVkcgaW1hZ2UgZmlsZXNdXG4gICAgQltEaWFncmFtIENhcHRpb248YnI-PGJyPkFkZCBGaWd1cmUgTnVtYmVyLiBhbmQ8YnI-Q2FwdGlvbiBUZXh0XVxuICAgIENbRGlhZ3JhbSBSZWZlcnJhbDxicj48YnI-UmVmZXJlbmVuY2UgRmlndXJlIE51bWJlcjxicj5pbiB0ZXh0XVxuXG4gICAgY2xhc3NEZWYgYm94IGZpbGw6I2ZmZixzdHJva2U6IzAwMCxzdHJva2Utd2lkdGg6MXB4LGNvbG9yOiMwMDA7XG4gICAgY2xhc3MgQSxCLEMgYm94IiwibWVybWFpZCI6IntcbiAgXCJ0aGVtZVwiOiBcImRlZmF1bHRcIlxufSIsInVwZGF0ZUVkaXRvciI6ZmFsc2UsImF1dG9TeW5jIjp0cnVlLCJ1cGRhdGVEaWFncmFtIjpmYWxzZX0" _blank
click B "https://mermaid-js.github.io/mermaid-live-editor/edit#eyJjb2RlIjoiZmxvd2NoYXJ0XG4gICAgQVtEaWFncmFtPGJyPjxicj5JbmxpbmUgTWVybWFpZCBvcjxicj5TVkcgaW1hZ2UgZmlsZXNdXG4gICAgQltEaWFncmFtIENhcHRpb248YnI-PGJyPkFkZCBGaWd1cmUgTnVtYmVyLiBhbmQ8YnI-Q2FwdGlvbiBUZXh0XVxuICAgIENbRGlhZ3JhbSBSZWZlcnJhbDxicj48YnI-UmVmZXJlbmVuY2UgRmlndXJlIE51bWJlcjxicj5pbiB0ZXh0XVxuXG4gICAgY2xhc3NEZWYgYm94IGZpbGw6I2ZmZixzdHJva2U6IzAwMCxzdHJva2Utd2lkdGg6MXB4LGNvbG9yOiMwMDA7XG4gICAgY2xhc3MgQSxCLEMgYm94IiwibWVybWFpZCI6IntcbiAgXCJ0aGVtZVwiOiBcImRlZmF1bHRcIlxufSIsInVwZGF0ZUVkaXRvciI6ZmFsc2UsImF1dG9TeW5jIjp0cnVlLCJ1cGRhdGVEaWFncmFtIjpmYWxzZX0" _blank
click C "https://mermaid-js.github.io/mermaid-live-editor/edit#eyJjb2RlIjoiZmxvd2NoYXJ0XG4gICAgQVtEaWFncmFtPGJyPjxicj5JbmxpbmUgTWVybWFpZCBvcjxicj5TVkcgaW1hZ2UgZmlsZXNdXG4gICAgQltEaWFncmFtIENhcHRpb248YnI-PGJyPkFkZCBGaWd1cmUgTnVtYmVyLiBhbmQ8YnI-Q2FwdGlvbiBUZXh0XVxuICAgIENbRGlhZ3JhbSBSZWZlcnJhbDxicj48YnI-UmVmZXJlbmVuY2UgRmlndXJlIE51bWJlcjxicj5pbiB0ZXh0XVxuXG4gICAgY2xhc3NEZWYgYm94IGZpbGw6I2ZmZixzdHJva2U6IzAwMCxzdHJva2Utd2lkdGg6MXB4LGNvbG9yOiMwMDA7XG4gICAgY2xhc3MgQSxCLEMgYm94IiwibWVybWFpZCI6IntcbiAgXCJ0aGVtZVwiOiBcImRlZmF1bHRcIlxufSIsInVwZGF0ZUVkaXRvciI6ZmFsc2UsImF1dG9TeW5jIjp0cnVlLCJ1cGRhdGVEaWFncmFtIjpmYWxzZX0" _blank
You should always add a caption to each diagram in your documentation.
Diagram
The Mermaid+SVG and External Tool methods generate .svg image files.
Here is the {{< figure >}} shortcode for the diagram defined in an
.svg image file saved to /images/development/contribute/documentation/components-of-kubernetes.svg:
{{< figure src="/images/development/contribute/documentation/components-of-kubernetes.svg" alt="United Manufacturing Hub pod running inside a cluster" class="diagram-large" caption="Figure 4. United Manufacturing Hub Architecture Components >}}
You should pass the src, alt, class and caption values into the
{{< figure >}} shortcode. You can adjust the size of the diagram using
diagram-large, diagram-medium and diagram-small classes.
Diagrams created using the `Inline` method don't use the `{{< figure >}}`
shortcode. The Mermaid code defines how the diagram will render on your page.
If you define your diagram in an .svg image file, then you should use the
{{< figure >}} shortcode’s caption parameter.
{{< figure src="/images/development/contribute/documentation/components-of-kubernetes.svg" alt="United Manufacturing Hub pod running inside a cluster" class="diagram-large" caption="Figure 4. United Manufacturing Hub Architecture Components" >}}
If you define your diagram using inline Mermaid code, then you should use Markdown text.
Figure 4. United Manufacturing Hub Architecture Components
The following lists several items to consider when adding diagram captions:
Use the {{< figure >}} shortcode to add a diagram caption for Mermaid+SVG
and External Tool diagrams.
Use simple Markdown text to add a diagram caption for the Inline method.
Prepend your diagram caption with Figure NUMBER.. You must use Figure
and the number must be unique for each diagram in your documentation page.
Add a period after the number.
Add your diagram caption text after the Figure NUMBER. on the same line.
You must puncuate the caption with a period. Keep the caption text short.
Position your diagram caption BELOW your diagram.
Diagram Referral
Finally, you can add a diagram referral. This is used inside your text and
should precede the diagram itself. It allows a user to connect your text with
the associated diagram. The Figure NUMBER in your referral and caption must
match.
You should avoid using spatial references such as ..the image below.. or
..the following figure ..
Here is an example of a diagram referral:
Figure 10 depicts the components of the United Manufacturing Hub architecture.
The control plane ...
Diagram referrals are optional and there are cases where they might not be
suitable. If you are not sure, add a diagram referral to your text to see if
it looks and sounds okay. When in doubt, use a diagram referral.
Complete picture
Figure 10 shows the United Manufacturing Hub Architecture diagram that includes the diagram,
diagram caption and diagram referral. The {{< figure >}} shortcode
renders the diagram, adds the caption and includes the optional link
parameter so you can hyperlink the diagram. The diagram referral is contained
in this paragraph.
Here is the {{< figure >}} shortcode for this diagram:
{{<figuresrc="/images/development/contribute/documentation/components-of-kubernetes.svg"alt="United Manufacturing Hub pod running inside a cluster"class="diagram-large"caption="Figure 10. United Manufacturing Hub Architecture."link="https://kubernetes.io/docs/concepts/overview/components/">}}
Figure 10. United Manufacturing Hub Architecture.
Tips
Always use the live editor to create/edit your diagram.
Always use Hugo local and Netlify previews to check out how the diagram
appears in the documentation.
Include diagram source pointers such as a URL, source code location, or
indicate the code is self-documenting.
Always use diagram captions.
Very helpful to include the diagram .svg or .png image and/or Mermaid
source code in issues and PRs.
With the Mermaid+SVG and External Tool methods, use .svg image files
because they stay sharp when you zoom in on the diagram.
Best practice for .svg files is to load it into an SVG editing tool and use the
“Convert text to paths” function.
This ensures that the diagram renders the same on all systems, regardless of font
availability and font rendering support.
No Mermaid support for additional icons or artwork.
Hugo Mermaid shortcodes don’t work in the live editor.
Any time you modify a diagram in the live editor, you must save it
to generate a new URL for the diagram.
Click on the diagrams in this section to view the code and diagram rendering
in the live editor.
Look over the source code of this page, diagram-guide.md, for more examples.
Check out the Mermaid docs
for explanations and examples.
Most important, Keep Diagrams Simple.
This will save time for you and fellow contributors, and allow for easier reading
by new and experienced users.
10.1.4.3.4 - Custom Hugo Shortcodes
This page explains the custom Hugo shortcodes used in United Manufacturing
Hub documentation.
One of the powerful features of Hugo is the ability to create custom shortcodes.
Shortcodes are simple snippets of code that you can use to add complex content
to your documentation.
You can use the codenew shortcode to display code examples in your documentation.
This is especially useful for code snippets that you want to reuse in multiple places.
After you add a new file with a code snippet in the examples directory, you can
reference it in your documentation using the codenew shortcode with the file
parameter set to the path to the file, relative to the examples directory.
A Copy button is automatically added to the code snippet. When the user clicks
the button, the code is copied to the clipboard.
You can use the heading shortcode to use localized strings as headings in your
documentation. The available headings are described in the content types
page.
For example, to create a whatsnext heading, add the heading shortcode with the “whatsnext” string:
## {{% heading "whatsnext" %}}
Include
You can use the include shortcode to include a file in your documentation.
This is especially useful for including markdown files that you want to reuse in
multiple places.
After you add a new file in the includes directory, you can reference it in your
documentation using the include shortcode with the first parameter set to the
path to the file, relative to the includes directory.
Here’s an example:
{{<include"pod-logs.md">}}
Mermaid
You can use the mermaid shortcode to display Mermaid diagrams in your documentation.
You can find more information in the diagram guide.
You can use the notice shortcode to display a notice in your documentation.
There are four types of notices: note, warning, info, and tip.
Here’s an example:
{{<noticenote>}}This is a note.
{{</notice>}}{{<noticewarning>}}This is a warning.
{{</notice>}}{{<noticeinfo>}}This is an info.
{{</notice>}}{{<noticetip>}}This is a tip.
{{</notice>}}
The rendered shortcode looks like this:
This is a note.
This is a warning.
This is an info.
This is a tip.
Resource
You can use the resource shortcode to display a resource in your documentation.
The resource shortcode takes these parameters:
name: The name of the resource.
type: The type of the resource.
This is useful for displaying resources which name might change over time, like
a pod name.
Here’s an example:
{{<resourcetype="pod"name="database">}}
The rendered shortcode looks like this: united-manufacturing-hub-timescaledb-0
The resources are defined in the i18n/en.toml file. You can add a new resource
by adding a new entry like [resource_<type>_<name>]
Table captions
You can make tables more accessible to screen readers by adding a table caption. To add a
caption to a table,
enclose the table with a table shortcode and specify the caption with the caption parameter.
Table captions are visible to screen readers but invisible when viewed in standard HTML.
Here’s an example:
{{<tablecaption="Configuration parameters">}}| Parameter | Description | Default |
| :--------- | :--------------------------- | :------ |
| `timeout` | The timeout for requests | `30s` |
| `logLevel` | The log level for log output | `INFO` |
{{</table>}}
The rendered table looks like this:
Configuration parameters
Parameter
Description
Default
timeout
The timeout for requests
30s
logLevel
The log level for log output
INFO
If you inspect the HTML for the table, you should see this element immediately
after the opening <table> element:
In a markdown page (.md file) on this site, you can add a tab set to display
multiple flavors of a given solution.
The tabs shortcode takes these parameters:
name: The name as shown on the tab.
codelang: If you provide inner content to the tab shortcode, you can tell Hugo
what code language to use for highlighting.
include: The file to include in the tab. If the tab lives in a Hugo
leaf bundle,
the file – which can be any MIME type supported by Hugo – is looked up in the bundle itself.
If not, the content page that needs to be included is looked up relative to the current page.
Note that with the include, you do not have any shortcode inner content and must use the
self-closing syntax. For example,
{{< tab name="Content File #1" include="example1" />}}. The language needs to be specified
under codelang or the language is taken based on the file name.
Non-content files are code-highlighted by default.
If your inner content is markdown, you must use the %-delimiter to surround the tab.
For example, {{% tab name="Tab 1" %}}This is **markdown**{{% /tab %}}
You can combine the variations mentioned above inside a tab set.
Below is a demo of the tabs shortcode.
The tab **name** in a `tabs` definition must be unique within a content page.
Tabs demo: Code highlighting
{{<tabsname="tab_with_code">}}{{<tabname="Tab 1"codelang="bash">}}echo "This is tab 1."
{{</tab>}}{{<tabname="Tab 2"codelang="go">}}println "This is tab 2."
{{</tab>}}{{</tabs>}}
{{<tabsname="tab_with_md">}}{{%tabname="Markdown"%}}This is **some markdown.**
{{<note>}}It can even contain shortcodes.
{{</note>}}{{%/tab%}}{{<tabname="HTML">}}<div>
<h3>Plain HTML</h3>
<p>This is some <i>plain</i> HTML.</p>
</div>
{{</tab>}}{{</tabs>}}
To generate a version string for inclusion in the documentation, you can choose from
several version shortcodes. Each version shortcode displays a version string derived from
the value of a version parameter found in the site configuration file, config.toml.
The two most commonly used version parameters are latest and version.
{{< param "version" >}}
The {{< param "version" >}} shortcode generates the value of the current
version of the Kubernetes documentation from the version site parameter. The
param shortcode accepts the name of one site parameter, in this case:
version.
In previously released documentation, `latest` and `version` parameter values
are not equivalent. After a new version is released, `latest` is incremented
and the value of `version` for the documentation set remains unchanged. For
example, a previously released version of the documentation displays `version`
as `v1.19` and `latest` as `v1.20`.
Renders to:
v0.2
{{< latest-umh-version >}}
The {{< latest-umh-version >}} shortcode returns the value of the latestUMH site parameter.
The latestUMH site parameter must be updated when a new version of the UMH Helm chart is released.
Renders to:
{{< latest-umh-semver >}}
The {{< latest-umh-semver >}} shortcode generates the value of latestUMH
without the “v” prefix.
Renders to:
{{< version-check >}}
The {{< version-check >}} shortcode checks if the min-kubernetes-server-version
page parameter is present and then uses this value to compare to version.
Renders to:
To check the United Manufacturing Hub version, open UMHLens / OpenLens and go to Helm > Releases. The version is listed in the Version column.
This page shows you how to localize the docs for a different language.
This page shows you how to
localize
the docs for a different language.
Contribute to an existing localization
You can help add or improve the content of an existing localization.
For extra details on how to contribute to a specific localization,
look for a localized version of this page.
Find your two-letter language code
First, consult the ISO 639-1standard to find your
localization’s two-letter language code. For example, the two-letter code for
German is de.
Some languages use a lowercase version of the country code as defined by the
ISO-3166 along with their language codes. For example, the Brazilian Portuguese
language code is pt-br.
git clone https://github.com/<username>/umh.docs.umh.app
cd umh.docs.umh.app
The website content directory includes subdirectories for each language. The
localization you want to help out with is inside content/<two-letter-code>.
Suggest changes
Create or update your chosen localized page based on the English original. See
translating content for more details.
If you notice a technical inaccuracy or other problem with the upstream
(English) documentation, you should fix the upstream documentation first and
then repeat the equivalent fix by updating the localization you’re working on.
Limit changes in a pull requests to a single localization. Reviewing pull
requests that change content in multiple localizations is problematic.
Follow Suggesting Content Improvements
to propose changes to that localization. The process is similar to proposing
changes to the upstream (English) content.
Start a new localization
If you want the United Manufacturing Hub documentation localized into a new language, here’s
what you need to do.
All localization teams must be self-sufficient. The United Manufacturing Hub website is happy
to host your work, but it’s up to you to translate it and keep existing
localized content current.
You’ll need to know the two-letter language code for your language. Consult the
ISO 639-1 standard
to find your localization’s two-letter language code. For example, the
two-letter code for Korean is ko.
If the language you are starting a localization for is spoken in various places
with significant differences between the variants, it might make sense to
combine the lowercased ISO-3166 country code with the language two-letter code.
For example, Brazilian Portuguese is localized as pt-br.
When you start a new localization, you must localize all the
minimum required content before
the United Manufacturing Hub project can publish your changes to the live
website.
Modify the site configuration
The United Manufacturing Hub website uses Hugo as its web framework. The website’s Hugo
configuration resides in the
config.toml
file. You’ll need to modify config.toml to support a new localization.
Add a configuration block for the new language to config.toml under the
existing [languages] block. The German block, for example, looks like:
[languages.de]
title = "United Manufacturing Hub"description = "Dokumentation des United Manufacturing Hub"languageName = "Deutsch (German)"languageNameLatinScript = "Deutsch"contentDir = "content/de"weight = 8
The language selection bar lists the value for languageName. Assign “language
name in native script and language (English language name in Latin script)” to
languageName. For example, languageName = "한국어 (Korean)" or languageName = "Deutsch (German)".
languageNameLatinScript can be used to access the language name in Latin
script and use it in the theme. Assign “language name in latin script” to
languageNameLatinScript. For example, languageNameLatinScript ="Korean" or
languageNameLatinScript = "Deutsch".
When assigning a weight parameter for your block, find the language block with
the highest weight and add 1 to that value.
For more information about Hugo’s multilingual support, see
“Multilingual Mode”.
Add a new localization directory
Add a language-specific subdirectory to the
content folder in
the repository. For example, the two-letter code for German is de:
mkdir content/de
You also need to create a directory inside i18n/ for
localized strings; look at existing localizations
for an example.
For example, for German the strings live in i18n/de.toml.
Open a pull request
Next, open a pull request
(PR) to add a localization to the united-manufacturing-hub/umh.docs.umh.app repository. The PR must
include all the minimum required content before it
can be approved.
Add a localized README file
To guide other localization contributors, add a new
README-**.md to the top
level of united-manufacturing-hub/umh.docs.umh.app, where
** is the two-letter language code. For example, a German README file would be
README-de.md.
Guide localization contributors in the localized README-**.md file.
Include the same information contained in README.md as well as:
A point of contact for the localization project
Any information specific to the localization
After you create the localized README, add a link to the file from the main
English README.md, and include contact information in English. You can provide
a GitHub ID, email address, Discord channel, or another
method of contact.
Launching your new localization
When a localization meets the requirements for workflow and minimum output, the
UMH team does the following:
Translated documents must reside in their own content/**/ subdirectory, but otherwise, follow the
same URL path as the English source. For example, to prepare the
Getting started tutorial for translation into German,
create a subfolder under the content/de/ folder and copy the English source:
Translation tools can speed up the translation process. For example, some
editors offer plugins to quickly translate text.
Machine-generated translation is insufficient on its own. Localization requires
extensive human review to meet minimum standards of quality.
To ensure accuracy in grammar and meaning, members of your localization team
should carefully review all machine-generated translations before publishing.
Source files
Localizations must be based on the English files from a specific release
targeted by the localization team. Each localization team can decide which
release to target, referred to as the target version below.
The main branch holds content for the current release .
Site strings in i18n
Localizations must include the contents of
i18n/en.toml
in a new language-specific file. Using German as an example:
i18n/de.toml.
Add a new localization file to i18n/. For example, with German (de):
cp i18n/en.toml i18n/de.toml
Revise the comments at the top of the file to suit your localization, then
translate the value of each string. For example, this is the German-language
placeholder text for the search form:
[ui_search_placeholder]
other = "Suchen"
Localizing site strings lets you customize site-wide text and features: for
example, the legal copyright text in the footer on each page.
10.1.4.5 - Versioning Documentation
This page describe how to version the documentation website.
With the Beta release of the Management Console, we are introducing a new
versioning system for the documentation website. This system will ensure that
the documentation is versioned in sync with the Management Console’s minor
versions. Each new minor release of the Management Console will correspond to a
new version of the documentation.
Branches
Below is an outline of the branching strategy we will employ for versioning the
documentation website:
main branch
The main branch will serve as the living documentation for the latest released
version of the Management Console. Following a new release, only patches and
hotfixes will be committed to this branch.
Version branches
Upon the release of a new minor version of the Management Console, a snapshot of
the main branch will be taken. This serves as an archive for the documentation
corresponding to the previous version. For instance, with the release of
Management Console version 1.1, we will create a branch from main named v1.0.
The v1.0 branch will host the documentation for the Management Console version
1.0 and will no longer receive updates for subsequent versions.
Development branches
Simultaneously with the snapshot creation, we’ll establish a development branch
for the upcoming version. For example, concurrent with the launch of Management
Console version 1.1, we will initiate a dev-v1.2 branch. This branch will
accumulate all the documentation updates for the forthcoming version of the
Management Console. Upon the release of the next version, we will merge the
dev-v1.2 branch into main, updating the documentation website to reflect the
newest version.
Hugo configuration
To maintain the versioning of our documentation website, specific adjustments
need to be made to the Hugo configuration file (hugo.toml). Follow the steps
below to ensure the versioning is correctly reflected.
Version branches
Update the latest parameter to match the branch version. For instance, for
the v1.0 branch, set latest to 1.0.
The [[params.versions]] array should include entries for the current
version and the upcoming version. For the v1.0 branch, the configuration
would be:
[[params.versions]]
version = "1.1"# Upcoming versionurl = "https://umh.docs.umh.app"branch = "main"[[params.versions]]
version = "1.0"# Current versionurl = "https://v1-0.umh-docs-umh-app.pages.dev/docs/"branch = "v1.0"
Development branches
Set the latest parameter to the version that the branch is preparing. If
the branch is dev-v1.2, then latest should be 1.2.
The [[params.versions]] array should list the version being developed
using the Cloudflare Pages URL. The entry for dev-v1.2 would be:
[[params.versions]]
version = "1.2"# Version in developmenturl = "https://dev-v1-2--umh-docs-umh-app.pages.dev"branch = "dev-v1.2"[[params.versions]]
version = "1.1"# latest versionurl = "https://umh.docs.umh.app"branch = "main"
Prior to merging a development branch into main, update the url for the
version being released to point to the main site and adjust the entry for the
previous version to its Cloudflare Pages URL. For instance, just before
merging dev-v1.2:
[[params.versions]]
version = "1.2"# New stable versionurl = "https://umh.docs.umh.app"branch = "main"[[params.versions]]
version = "1.1"# Previous versionurl = "https://v1-1--umh-docs-umh-app.pages.dev"branch = "v1.1"
Always ensure that the [[params.versions]] array reflects the correct order of
the versions, with the newest version appearing first.
10.2 - Debugging using fgtrace
Tutorial on how to get started with fgtrace
Enable fgtrace
Forward the new fgtrace port
Visit the /debug/fgtrace trace path using Insomnia or a similar tool. Please note that it will take about half a minute for a trace to complete.