This is the multi-page printable view of this section. Click here to print.
Features
- 1: Connectivity
- 1.1: Node-RED
- 1.2: Benthos UMH
- 1.3: Other Tools
- 2: Data Infrastructure
- 2.1: Unified Namespace
- 2.2: Historian / Data Storage
- 2.3: Shopfloor KPIs / Analytics (v1)
- 2.4: Alerting
- 3: Device & Container Infrastructure
- 3.1: Provisioning
- 3.2: Monitoring & Management
- 3.3: UMH Lite
- 3.4: Layered Scaling
- 3.5: Upgrading
1 - Connectivity
In IIoT infrastructures, sometimes can be challenging to extract and contextualize data from from various systems into the Unified Namespace, because there is no universal solution. It usually requires lots of different tools, each one tailored to the specific infrastructure, making it hard to manage and maintain.
With the United Manufacturing Hub and the Management Console, we aim to solve this problem by providing a simple and easy to use tool to manage all the assets in your factory.
For lack of a better term, when talking about a system that can be connected to and that provides data, we will use the term asset.
When should I use it?
Contextualizing data can present a variety of challenges, both technical and at the organization level. The Connection Management functionality aims to reduce the complexity that comes with these challenges.
Here are some common issues that can be solved with the Connection Management:
- It is hard to get an overview of all the data sources and their connections' status, as the concepts of “connection” and “data source” are often decoupled. This leads to list the connections’ information into long spreadsheets, which are hard to maintain and troubleshoot.
- Handling uncommon communication protocols.
- Dealing with non-standard connections, like a 4-20 mA sensor or a USB-connected barcode reader.
- Advanced IT tools like Apache Spark or Apache Flink may be challenging for OT personnel who have crucial domain knowledge.
- Traditional OT tools often struggle in modern IT environments, lacking features like Docker compatibility, monitoring, automated backups, or high availability.
What can I do with it?

The Connection Management functionality in the Management Console aims to address those challenges by providing a simple and easy to use tool to manage all the assets in your factory.
You can add, delete, and most importantly, visualize the status of all your connections in a single place. For example, a periodic check is performed to measure the latency of each connection, and the status of the connection is displayed in the Management Console.
You can also add notes to each connection, so that you can keep all the documentation in a single place.

You can then configure a data source for each connection, to start extracting data from your assets. Once the data source is configured, specific information about its status is displayed, prompting you in case of misconfigurations, data not being received, or other any error that may occur.
How can I use it?
Add new connections from the Connection Management page of the Management Console. Then, configure a data source for each of them by choosing one of the available tools, depending on the type of connection.
The following tools come with the United Manufacturing Hub and are recommended for extracting data from your assets:
Node-RED
Node-RED is a leading open-source tool for IIoT connectivity. We recommend this tool for prototyping and integrating parts of the shop floor that demand high levels of customization and domain knowledge.
Even though it may be unreliable in high-throughput scenarios, it has a vast global community that provides a wide range of connectors for different protocols and data sources, while remaining very user-friendly with its visual programming approach.
Benthos UMH
Benthos UMH is a custom extension of the Benthos project. It allows you to connect assets that communicate via the OPC UA protocol, and it is recommended for scenarios involving the extraction of large data volumes in a standardized format.
It is a lightweight, open-source tool that is easy to deploy and manage. It is ideal for moving medium-sized data volumes more reliably then Node-RED, but it requires some technical knowledge.
Other Tools
The United Manufacturing Hub also provides tools for connecting data sources that uses other types of connections. For example, you can easily connect ifm IO-Link sensors or USB barcode readers.
Third-Party Tools
Any existing connectivity solution can be integrated with the United Manufacturing Hub, assuming it can send data to either MQTT or Kafka. Additionally, if you want to deploy those tools on the Device & Container Infrastructure, they must be available as a Docker container (developed with best-practices). Therefore, we recommend using the tools mentioned above, as they are the most tested and reliable.
What are the limitations?
Some of the tools still require some technical knowledge to be used. We are working on improving the user experience and documentation to make them more accessible.
Where to get more information?
- Follow the Get started guide to learn how to connect your assets to the United Manufacturing Hub.
- Deep dive into the Node-RED features.
- Explore retrofitting with ifm IO-Link master and sensorconnect.
- Learn how to retrofit with USB barcodereader.
1.1 - Node-RED
One feature of the United Manufacturing Hub is to connect devices on the shopfloor such as PLCs, Quality Stations or MES / ERP systems with the Unified Namespace using Node-RED. Node-RED has a large library of nodes, which lets you connect various protocols. It also has a user-friendly UI with little code, making it easy to configure the desired nodes.

When should I use it?
Sometimes it is necessary to connect a lot of different protocols (e.g Siemens-S7, OPC-UA, Serial, …) and node-RED can be a maintainable solution to connect all these protocols without the need for other data connectivity tools. Node-RED is largely known in the IT/OT-Community making it a familiar tool for a lot of users.
What can I do with it?
By default, there are connector nodes for common protocols:
- connect to MQTT using the MQTT node
- connect to HTTP using the HTTP node
- connect to TCP using the TCP node
- connect to IP using the UDP node
Furthermore, you can install packages to support more connection protocols. For example:
- connect to OPC-UA (node-red-contrib-opcua)
- connect to kafka (node-red-contrib-kafkajs)
- connect to Siemens-S7 (node-red-contrib-s7)
- connect to serial (node-red-node-serialport)
- connect to modbus (node-red-contrib-modbus)
- connect to MC-protocol (node-red-contrib-mcprotocol)
- connect to OMRON FINS Ethernet protocol (node-red-contrib-omron-fins)
- connect to EtherNet/IP Protocol (node-red-contrib-cip-ethernet-ip)
- connect to PostgreSQL (node-red-contrib-postgresql)
- connect to SAP SQL Anywhere
You can additionally contextualize the data, using function or other different nodes do manipulate the received data.
How can I use it?
Node-RED comes preinstalled as a microservice with the United Manufacturing Hub.
- To access Node-RED, simply open the following URL in your browser:
http://<instance-ip-address>:1880/nodered
Begin exploring right away! If you require inspiration on where to start, we provide a variety of guides to help you become familiar with various node-red workflows, including how to process data and align it with the UMH datamodel:
- Create a Node-RED Flow with Simulated OPC-UA Data
- Create a Node-RED flow with simulated PackML data
- Alternatively, visit learning page where you can find multiple best practices for using Node-RED
What are the limitations?
- Most packages have no enterprise support. If you encounter any errors, you need to ask the community. However, we found that these packages are often more stable than the commercial ones out there, as they have been battle tested by way more users than commercial software.
- Having many flows without following a strict structure, leads in general to confusion.
- One additional limitation is “the speed of development of Node-RED”. After a big Node-RED and JavaScript update dependencies most likely break, and those single community maintained nodes need to be updated.
Where to get more information?
- Learn more about Node-RED and the United Manufacturing Hub by following our Get started guide .
- Learn more about Best-practices & guides for Node-RED.
- Learn how to connect Node-RED to SAP SQL Anywhere with a custom docker instance.
- Checkout the industrial forum for Node-RED
1.2 - Benthos UMH
Benthos is a stream processing tool that is designed to make common data engineering tasks such as transformations, integrations, and multiplexing easy to perform and manage. It uses declarative, unit-testable configuration, allowing users to easily adapt their data pipelines as requirements change. Benthos is able to connect to a wide range of sources and sinks, and can use different languages for processing and mapping data.
Benthos UMH is a custom extension of Benthos that is designed to connect to OPC-UA servers and stream data into the Unified Namespace.
When should I use it?
Benthos UMH is valuable for integrating different protocols with the Unified Namespace. With it, you can configure various protocol converters, define the data you want to stream, and send it to the Unified Namespace.
Furthermore, in our tests, Benthos has proven more reliable than tools like Node-RED, when it comes to handling large amounts of data.
What can I do with it?
Benthos UMH offers some benefits, including:
- Management Console integration: Configure and deploy any number of protocol converters via Benthos UMH directly from the Management Console.
- OPC-UA support: Connect to any OPC-UA server and stream data into the Unified Namespace.
- Report by exception: By configuring the OPC-UA nodes in subscribe mode, you can only stream data when the value of the node changes.
- Per-node configuration: Define the nodes you want to stream and configure them individually.
- Broad customization: Use Benthos’ extensive configuration options to customize your data pipeline.
- Easy deployment: Deploy Benthos UMH as a standalone Docker container or directly from the Management Console.
- Fully open source: Benthos UMH is fully open source and available on Github.
How can I use it?
With the Management Console
The easiest way to use Benthos UMH is to deploy it directly from the Management Console.
After adding your network device or service, you can initialize the protocol converter. Simply click on the Play button next to the network device/service at the Protocol Converters tab. From there, you’ll have two options to choose from when configuring the protocol converter:
OPC-UA: Select this option if you specifically need to configure OPC-UA protocol converters. It offers direct integration with OPC-UA servers and improved data contextualization. This is particularly useful when you need to assign tags to specific data points within the Unified Namespace. You’ll be asked to define OPC-UA nodes in YAML format, detailing the nodes you want to stream from the OPC-UA server.
Universal Protocol Converter: Opt for this choice if you need to configure protocol converters for various supported protocols other than OPC-UA. This option will prompt you to define the Benthos input and processor configuration in YAML format.
For OPC-UA, ensure your YAML configuration follows the format below:
nodes:
  - opcuaID: ns=2;s=Pressure
    enterprise: pharma-genix
    site: aachen
    area: packaging
    line: packaging_1
    workcell: blister
    originID: PLC13
    tagName: machineState
    schema: _historian
Required fields are opcuaID, enterprise, tagName and schema. opcuaID
is the NodeID in OPC-UA and can also be a folder (see README
for more information). The remaining components are components of the resulting
topic / ISA-95 structure (see also our datamodel). By default,
the schema will always be in _historian, and tagName is the keyname.
Standalone
Benthos UMH can be manually deployed as part of the UMH stack using the provided Docker image and following the instructions outlined in the README.
For more specialized use cases requiring precise configuration, standalone deployment offers full control over the setup. However, this manual approach is more complex compared to using the Universal Protocol Converter feature directly from the Management Console.
Read the official Benthos documentation for more information on how to use different components.
What are the limitations?
Benthos UMH excels in scalability, making it a robust choice for complex setups managing large amounts of data. However, its initial learning curve may be steeper due to its scripting language and a more hands-on approach to configuration.
As an alternative, Node-RED offers ease of use with its low-code approach and the popularity of JavaScript. It’s particularly easy to start with, but as your setup grows, it becomes harder to manage, leading to confusion and loss of oversight.
Where to get more information?
- Learn more about Benthos UMH in the Github repository.
- Explore the Data Model.
- Confront these features with Node-RED.
1.3 - Other Tools
1.3.1 - Retrofitting with ifm IO-link master and sensorconnect
Retrofitting older machines with sensors is sometimes the only-way to capture process-relevant information. In this article, we will focus on retrofitting with ifm IO-Link master and Sensorconnect, a microservice of the United Manufacturing Hub, that finds and reads out ifm IO-Link masters in the network and pushes sensor data to MQTT/Kafka for further processing.

When should I use it?
Retrofitting with ifm IO-Link master such as the AL1350 and using Sensorconnect is ideal when dealing with older machines that are not equipped with any connectable hardware to read relevant information out of the machine itself. By placing sensors on the machine and connecting them with IO-Link master, required information can be gathered for valuable insights. Sensorconnect helps to easily connect to all sensors correctly and properly capture the large amount of sensor data provided.
What can I do with it?
With ifm IO-Link master and Sensorconnect, you can collect data from sensors and make it accessible for further use. Sensorconnect offers:
- Automatic detection of ifm IO-Link masters in the network.
- Identification of IO-Link and alternative digital or analog sensors connected to the master using converter such as the DP2200. Digital Sensors employ a voltage range from 10 to 30V DC, producing binary outputs of true or false. In contrast, analog sensors operate at 24V DC, with a current range spanning from 4 to 20 mA. Utilizing the appropriate converter, analog outputs can be effectively transformed into digital signals.
- Constant polling of data from the detected sensors.
- Interpreting the received data based on a sensor database containing thousands of entries.
- Sending data in JSON format to MQTT and Kafka for further data processing.
How can I use it?
To use ifm IO-link gateways and Sensorconnect please follow these instructions:
- Ensure all IO-Link gateways are in the same network or accessible from your instance of the United Manufacturing Hub.
- Retrofit the machines by connecting the desired sensors and establish a connection with ifm IO-Link gateways.
- Deploy the sensorconnect feature and configure the Sensorconnect IP-range to either match the IP address using subnet notation /32, or, in cases involving multiple masters, configure it to scan an entire range, for example /24. To deploy the feature and change the value, execute the following command with your IP range:
sudo $(which helm) upgrade --kubeconfig /etc/rancher/k3s/k3s.yaml -n united-manufacturing-hub united-manufacturing-hub united-manufacturing-hub/united-manufacturing-hub --set _000_commonConfig.datasources.sensorconnect.enabled=true,_000_commonConfig.datasources.sensorconnect.iprange=<ip-range> --reuse-values --version $(sudo $(which helm) ls --kubeconfig /etc/rancher/k3s/k3s.yaml -n united-manufacturing-hub -o json | jq -r '.[0].app_version') - Once completed, the data should be available in your Unified Namespace.
What are the limitations?
- The current ifm firmware has a software bug, that will cause the IO-Link master to crash if it receives to many requests. To resolve this issue, you can either request an experimental firmware, which is available exclusively from ifm, or re-connect the power to the IO-Link gateway.
Where to get more information?
1.3.2 - Retrofitting with USB barcodereader
The barcodereader microservice enables the processing of barcodes from USB-linked scanner devices, subsequently publishing the acquired data to the Unified Namespace.
When should I use it?
When you need to connect a barcode reader or any other USB devices acting as a keyboard (HID). These cases could be to scan an order at the production machine from the accompanying order sheet. Or To scan material for inventory and track and trace.
What can I do with it?
You can connect USB devices acting as a keyboard to the Unified Namespace. It will record all inputs and send it out once a return / enter character has been detected. A lof of barcode scanners work that way. Additionally, you can also connect something like a quality testing station (we once connected a Mitutoyo quality testing station).
How can I use it?
To use the microservice barcode reader, you will need configure the helm-chart and enable it.
- Enable the barcodereader feature by executing the following command:
sudo $(which helm) upgrade --kubeconfig /etc/rancher/k3s/k3s.yaml -n united-manufacturing-hub united-manufacturing-hub united-manufacturing-hub/united-manufacturing-hub --set _000_commonConfig.datasources.barcodereader.enabled=true --reuse-values --version $(sudo $(which helm) ls --kubeconfig /etc/rancher/k3s/k3s.yaml -n united-manufacturing-hub -o json | jq -r '.[0].app_version') - During startup, it will show all connected USB devices. Remember yours and then change the
INPUT_DEVICE_NAMEandINPUT_DEVICE_PATH. Also setASSET_ID,CUSTOMER_ID, etc. as this will then send it into the topicia/ASSET_ID/.../barcode. You can change these values of the helm chart usinghelm upgrade. You find the list of parameters here. The following command should be executed, for example:sudo $(which helm) upgrade --kubeconfig /etc/rancher/k3s/k3s.yaml -n united-manufacturing-hub united-manufacturing-hub united-manufacturing-hub/united-manufacturing-hub --set _000_commonConfig.datasources.barcodereader.USBDeviceName=<input-device-name>,_000_commonConfig.datasources.barcodereader.USBDevicePath=<input-device-path>,_000_commonConfig.datasources.barcodereader.machineID=<asset-id>,_000_commonConfig.datasources.barcodereader.customerID=<customer-id> --reuse-values --version $(sudo $(which helm) ls --kubeconfig /etc/rancher/k3s/k3s.yaml -n united-manufacturing-hub -o json | jq -r '.[0].app_version') - Scan a device, and it will be written into the topic
ia/ASSET_ID/.../barcode.
Once installed, you can configure the microservice by setting the needed environment variables. The program will continuously scan for barcodes using the device and publish the data to the Kafka topic.
What are the limitations?
- Sometimes special characters are not parsed correctly. They need to be adjusted afterward in the Unified Namespace.
Where to get more information?
- You can get more information in the technical documentation of barcodereader
- Our helm chart reference provides lists of configuration parameters.
2 - Data Infrastructure
2.1 - Unified Namespace
The Unified Namespace is a centralized, standardized, event-driven data architecture that enables for seamless integration and communication across various devices and systems in an industrial environment. It operates on the principle that all data, regardless of whether there is an immediate consumer, should be published and made available for consumption. This means that any node in the network can work as either a producer or a consumer, depending on the needs of the system at any given time.
This architecture is the foundation of the United Manufacturing Hub, and you can read more about it in the Learning Hub article.
When should I use it?
In our opinion, the Unified Namespace provides the best tradeoff for connecting systems in manufacturing / shopfloor scenarios. It effectively eliminates the complexity of spaghetti diagrams and enables real-time data processing.
While data can be shared through databases, REST APIs, or message brokers, we believe that a message broker approach is most suitable for most manufacturing applications. Consequently, every piece of information within the United Manufacturing Hub is transmitted via a message broker.
Both MQTT and Kafka are used in the United Manufacturing Hub. MQTT is designed for the safe message delivery between devices and simplifies gathering data on the shopfloor. However, it is not designed for reliable stream processing. Although Kafka does not provide a simple way to collect data, it is suitable for contextualizing and processing data. Therefore, we are combining both the strengths of MQTT and Kafka. You can get more information from this article.
What can I do with it?
The Unified Namespace in the United Manufacturing Hub provides you the following functionalities and applications:
- Seamless Integration with MQTT: Facilitates straightforward connection with modern industrial equipment using the MQTT protocol.
- Legacy Equipment Compatibility: Provides easy integration with older systems using tools like Node-RED or Benthos UMH, supporting various protocols like Siemens S7, OPC-UA, and Modbus.
- Real-time Notifications: Enables instant alerting and data transmission through MQTT, crucial for time-sensitive operations.
- Historical Data Access: Offers the ability to view and analyze past messages stored in Kafka logs, which is essential for troubleshooting and understanding historical trends.
- Scalable Message Processing: Designed to handle a large amount of data
from a lot of devices efficiently, ensuring reliable message delivery even
over unstable network connections. By using IT standard tools, we can
theoretically process data in the measure of
GB/secondinstead ofmessages/second. - Data Transformation and Transfer: Utilizes the Data Bridge to adapt and transmit data between different formats and systems, maintaining data consistency and reliability.
Each feature opens up possibilities for enhanced data management, real-time monitoring, and system optimization in industrial settings.
You can view the Unified Namespace by using the Management Console like in the picture
below. The picture shows data under the topic
umh/v1/demo-pharma-enterprise/Cologne/_historian/rainfall/isRaining, where
umh/v1is a versioning prefix.demo-pharma-enterpriseis a sampleenterprisetag.Cologneis a samplesitetag._historianis a schema tag. Data with this tag will be stored in the UMH’s database.rainfall/isRainingis a sample schema dependent context, whererainfallis a tag group andisRainingis a tag belonging to it.
The full tag name uniquely identifies a single tag, it can be found in the Publisher & Subscriber Info table.

The above image showcases the Tag Browser, our main tool for navigating the Unified Namespace. It includes the
following features:
- Data Aggregation: Automatically consolidates data from all connected instances / brokers.
- Topic Structure: Displays the hierarchical structure of topics and which data belongs to which namespace.
- Tag Folder Structure: Facilitates browsing through tag folders or groups within a single asset.
- Schema validation: Introduces validation for known schemas such as
_historian. In case of validation failure, the corresponding errors are displayed. - Tag Error Tracing: Enables error tracing within the Unified Namespace tree. When errors are detected in tags or schemas, all affected nodes are highlighted with warnings, making it easier to track down the troubled source tags or schemas.
- Publisher & Subscriber Info: Provides various details, such as the origins and destinations of the data, the instance it was published from, the messages per minute to get an overview on how much data is flowing, and the full tag name to uniquely identify the selected tag.
- Payload Visualization: Displays payloads under validated schemas in a formatted/structured manner, enhancing readability. For unknown schemas without strict validation, the raw payload is displayed instead.
- Tag Value History: Shows the last 100 received values for the selected tag, allowing you to track the
changes in the data over time. Keep in mind that this feature is only available for tags that are part of the
_historianschema. - Example SQL Query: Generates example SQL queries based on the selected tag, which can be used to query the data in the UMH’s database or in Grafana for visualization purposes.
- Kafka Origin: Provides information about the Kafka key, topic and the actual payload that was sent via Kafka.
It’s important to note that data displayed in the Tag Browser represent snapshots; hence, data sent at
intervals shorter than 10 seconds may not be accurately reflected.
You can find more detailed information about the topic structure here.
You can also use tools like MQTT Explorer
(not included in the UMH) or Redpanda Console (enabled by defualt, accessible
via port 8090) to view data from a single instance (but single instance only).
How can I use it?
To effectively use the Unified Namespace in the United Manufacturing Hub, start by configuring your IoT devices to communicate with the UMH’s MQTT broker, considering the necessary security protocols. While MQTT is recommended for gathering data on the shopfloor, you can send messages to Kafka as well.
Once the devices are set up, handle the incoming data messages using tools like Node-RED or Benthos UMH. This step involves adjusting payloads and topics as needed. It’s also important to understand and follow the ISA95 standard model for data organization, using JSON as the primary format.
Additionally, the Data Bridge
microservice plays a crucial role in transferring and transforming data between
MQTT and Kafka, ensuring that it adheres to the UMH data model. You can
configure a merge point to consolidate messages from multiple MQTT topics into
a single Kafka topic. For instance, if you set a merge point of 3, the Data
Bridge will consolidate messages from more detailed topics like
umh/v1/plant1/machineA/temperature into a broader topic like umh/v1/plant1.
This process helps in organizing and managing data efficiently, ensuring that
messages are grouped logically while retaining key information for each topic
in the Kafka message key.
Recommendation: Send messages from IoT devices via MQTT and then work in Kafka only.
What are the limitations?
While JSON is the only supported payload format due to its accessibility, it’s important to note that it can be more resource-intensive compared to formats like Protobuf or Avro.
Where to get more information?
- Explore the UMH architecture and data model.
- Read articles about MQTT, Kafka, and the Unified Namespace on the Learning Hub.
- Read the blog article about Tools & Techniques for scalable data processing in Industrial IoT.
2.2 - Historian / Data Storage
The Historian / Data Storage feature in the United Manufacturing Hub provides reliable data storage and analysis for your manufacturing data. Essentially, a Historian is just another term for a data storage system, designed specifically for time-series data in manufacturing.
When should I use it?
If you want to reliably store data from your shop floor that is not designed to fulfill any legal purposes, such as GxP, we recommend you to use the United Manufacturing Hub’s Historian feature. In our opinion, open-source databases such as TimescaleDB are superior to traditional historians in terms of reliability, scalability and maintainability, but can be challenging to use for the OT engineer. The United Manufacturing Hub fills this usability gap, allowing OT engineers to easily ingest, process, and store data permanently in an open-source database.
What can I do with it?
The Historian / Data Storage feature of the United Manufacturing Hub allows you to:
Store and analyze data
- Store data in TimescaleDB by using either the
_historian
or
_analytics_schemas in the topics within the Unified Namespace. - Data can be sent to the Unified Namespace from various sources, allowing you to store tags from your PLC and production lines reliably. Optionally, you can use tag groups to manage a large number of tags and reduce the system load. Our Data Model page assists you in learning data modeling in the Unified Namespace.
- Conduct basic data analysis, including automatic downsampling, gap filling, and statistical functions such as Min, Max, and Avg.
Query and visualize data
- Query data in an ISA95 compliant model, from enterprise to site, area, production line, and work cell.
- Visualize your data in Grafana to easily monitor and troubleshoot your production processes.
More information about the exact analytics functionalities can be found in the umh-datasource-v2 documentation.
Efficiently manage data
- Compress and retain data to reduce database size using various techniques.
How can I use it?
To store your data in TimescaleDB, simply use the _historian or _analytics
_schemas in your Data Model v1
compliant topic. This can be directly done in the OPC UA data source
when the data is first inserted into the stack. Alternatively, it can be handled
in Node-RED, which is useful if you’re still utilizing the old data model,
or if you’re gathering data from non-OPC UA sources via Node-RED or
sensorconnect.
Data sent with a different _schema will not be stored in
TimescaleDB.
Data stored in TimescaleDB can be viewed in Grafana. An example can be found in the Get Started guide.
In Grafana you can select tags by using SQL queries. Here, you see an example:
SELECT name, value, timestamp
FROM tag
WHERE asset_id = get_asset_id_immutable(
  'pharma-genix',
  'aachen',
  'packaging',
  'packaging_1',
  'blister'
);
get_asset_id_immutable is a custom plpgsql function that we provide to simplify the
process of querying tag data from a specific asset. To learn more about our
database, visit this page.
Also, you have the option to query data in your custom code by utilizing the API in factoryinsight or processing the data in the Unified Namespace.
For more information about what exactly is behind the Historian feature, check out our our architecture page.
What are the limitations?
- In order to store messages, you should transform data and use our topic
structure. The payload must be in JSON using
a specific format,
and the message must be tagged with
_historian. - After storing a couple of millions messages, you should consider compressing the messages or establishing retention policies.
Apart from these limitations, the United Manufacturing Hub’s Historian feature is highly performant compared to legacy Historians.
Where to get more information?
- Learn more about the benefits of using open-source databases in our blog article, Historians vs Open-Source databases - which is better?
- Check out the Getting Started guide to start using the Historian feature.
- Learn more about the United Manufacturing Hub’s architecture by visiting our architecture page.
- Learn more about our Data Model by visiting this page.
- Learn more about our database for
_historianschema by visiting our documentation.
2.3 - Shopfloor KPIs / Analytics (v1)
The Shopfloor KPI / Analytics feature of the United Manufacturing Hub provides a configurable and plug-and-play approach to create “Shopfloor Dashboards” for production transparency consisting of various KPIs and drill-downs.


Click on the images to enlarge them. More examples can be found in this YouTube video and in our community-repo on GitHub.
When should I use it?
If you want to create production dashboards that are highly configurable and can drill down into specific KPIs, the Shopfloor KPI / Analytics feature of the United Manufacturing Hub is an ideal choice. This feature is designed to help you quickly and easily create dashboards that provide a clear view of your shop floor performance.
What can I do with it?
The Shopfloor KPI / Analytics feature of the United Manufacturing Hub allows you to:
Query and visualize
In Grafana, you can:
- Calculate the OEE (Overall Equipment Effectiveness) and view trends over time
- Availability is calculated using the formula
(plannedTime - stopTime) / plannedTime, whereplannedTimeis the duration of time for all machines states that do not belong in the Availability or Performance category, andstopTimeis the duration of all machine states configured to be an availability stop. - Performance is calculated using the formula
runningTime / (runningTime + stopTime), whererunningTimeis the duration of all machine states that consider the machine to be running, andstopTimeis the duration of all machine states that are considered a performance loss. Note that this formula does not take into account losses caused by letting the machine run at a lower speed than possible. To approximate this, you can use the LowSpeedThresholdInPcsPerHour configuration option (see further below). - Quality is calculated using the formula
good pieces / total pieces
- Availability is calculated using the formula
- Drill down into stop reasons (including histograms) to identify the root-causes for a potentially low OEE.
- List all produced and planned orders including target vs actual produced pieces, total production time, stop reasons per order, and more using job and product tables.
- See machine states, shifts, and orders on timelines to get a clear view of what happened during a specific time range.
- View production speed and produced pieces over time.
Configure
In the database, you can configure:
- Stop Reasons Configuration: Configure which stop reasons belong into which category for the OEE calculation and whether they should be included in the OEE calculation at all. For instance, some companies define changeovers as availability losses, some as performance losses. You can easily move them into the correct category.
- Automatic Detection and Classification: Configure whether to automatically detect/classify certain types of machine states and stops:
- AutomaticallyIdentifyChangeovers: If the machine state was an unspecified machine stop (UnknownStop), but an order was recently started, the time between the start of the order until the machine state turns to running, will be considered a Changeover Preparation State (10010). If this happens at the end of the order, it will be a Changeover Post-processing State (10020).
- MicrostopDurationInSeconds: If an unspecified stop (UnknownStop) has a duration smaller than a configurable threshold (e.g., 120 seconds), it will be considered a Microstop State (50000) instead. Some companies put small unknown stops into a different category (performance) than larger unknown stops, which usually land up in the availability loss bucket.
- IgnoreMicrostopUnderThisDurationInSeconds: In some cases, the machine can actually stop for a couple of seconds in routine intervals, which might be unwanted as it makes analysis difficult. One can set a threshold to ignore microstops that are smaller than a configurable threshold (usually like 1-2 seconds).
- MinimumRunningTimeInSeconds: Same logic if the machine is running for a couple of seconds only. With this configurable threshold, small run-times can be ignored. These can happen, for example, during the changeover phase.
- ThresholdForNoShiftsConsideredBreakInSeconds: If no shift was planned, an UnknownStop will always be classified as a NoShift state. Some companies move smaller NoShift’s into their category called “Break” and move them either into Availability or Performance.
- LowSpeedThresholdInPcsPerHour: For a simplified performance calculation, a threshold can be set, and if the machine has a lower speed than this, it could be considered a LowSpeedState and could be categorized into the performance loss bucket.
- Language Configuration: The language of the machine states can be configured using the languageCode configuration option (or overwritten in Grafana).
You can find the configuration options in the configurationTable
How can I use it?
Using it is very easy:
- Send messages according to the UMH datamodel to the Unified Namespace (similar to the Historian feature)
- Configure your OEE calculation by adjusting the configuration table
- Open Grafana, and checkout our tutorial on how to select the data.
For more information about what exactly is behind the Analytics feature, check out our architecture page and our datamodel
Where to get more information?
- Learn more about the benefits of using open-source databases in our blog article, Historians vs Open-Source databases - which is better?
- Learn more about the United Manufacturing Hub’s architecture by visiting our architecture page.
- Learn more about the datamodel by visiting our datamodel
- To build visual dashboards, check out our tutorial on using Grafana Canvas
2.3.1 - Shopfloor KPIs / Analytics (v0)
The Shopfloor KPI / Analytics feature of the United Manufacturing Hub provides a configurable and plug-and-play approach to create “Shopfloor Dashboards” for production transparency consisting of various KPIs and drill-downs.
When should I use it?
If you want to create production dashboards that are highly configurable and can drill down into specific KPIs, the Shopfloor KPI / Analytics feature of the United Manufacturing Hub is an ideal choice. This feature is designed to help you quickly and easily create dashboards that provide a clear view of your shop floor performance.
What can I do with it?
The Shopfloor KPI / Analytics feature of the United Manufacturing Hub allows you to:
Query and visualize
In Grafana, you can:
- Calculate the OEE (Overall Equipment Effectiveness) and view trends over time
- Availability is calculated using the formula
(plannedTime - stopTime) / plannedTime, whereplannedTimeis the duration of time for all machines states that do not belong in the Availability or Performance category, andstopTimeis the duration of all machine states configured to be an availability stop. - Performance is calculated using the formula
runningTime / (runningTime + stopTime), whererunningTimeis the duration of all machine states that consider the machine to be running, andstopTimeis the duration of all machine states that are considered a performance loss. Note that this formula does not take into account losses caused by letting the machine run at a lower speed than possible. To approximate this, you can use the LowSpeedThresholdInPcsPerHour configuration option (see further below). - Quality is calculated using the formula
good pieces / total pieces
- Availability is calculated using the formula
- Drill down into stop reasons (including histograms) to identify the root-causes for a potentially low OEE.
- List all produced and planned orders including target vs actual produced pieces, total production time, stop reasons per order, and more using job and product tables.
- See machine states, shifts, and orders on timelines to get a clear view of what happened during a specific time range.
- View production speed and produced pieces over time.
Configure
In the database, you can configure:
- Stop Reasons Configuration: Configure which stop reasons belong into which category for the OEE calculation and whether they should be included in the OEE calculation at all. For instance, some companies define changeovers as availability losses, some as performance losses. You can easily move them into the correct category.
- Automatic Detection and Classification: Configure whether to automatically detect/classify certain types of machine states and stops:
- AutomaticallyIdentifyChangeovers: If the machine state was an unspecified machine stop (UnknownStop), but an order was recently started, the time between the start of the order until the machine state turns to running, will be considered a Changeover Preparation State (10010). If this happens at the end of the order, it will be a Changeover Post-processing State (10020).
- MicrostopDurationInSeconds: If an unspecified stop (UnknownStop) has a duration smaller than a configurable threshold (e.g., 120 seconds), it will be considered a Microstop State (50000) instead. Some companies put small unknown stops into a different category (performance) than larger unknown stops, which usually land up in the availability loss bucket.
- IgnoreMicrostopUnderThisDurationInSeconds: In some cases, the machine can actually stop for a couple of seconds in routine intervals, which might be unwanted as it makes analysis difficult. One can set a threshold to ignore microstops that are smaller than a configurable threshold (usually like 1-2 seconds).
- MinimumRunningTimeInSeconds: Same logic if the machine is running for a couple of seconds only. With this configurable threshold, small run-times can be ignored. These can happen, for example, during the changeover phase.
- ThresholdForNoShiftsConsideredBreakInSeconds: If no shift was planned, an UnknownStop will always be classified as a NoShift state. Some companies move smaller NoShift’s into their category called “Break” and move them either into Availability or Performance.
- LowSpeedThresholdInPcsPerHour: For a simplified performance calculation, a threshold can be set, and if the machine has a lower speed than this, it could be considered a LowSpeedState and could be categorized into the performance loss bucket.
- Language Configuration: The language of the machine states can be configured using the languageCode configuration option (or overwritten in Grafana).
You can find the configuration options in the configurationTable
How can I use it?
Using it is very easy:
- Send messages according to the UMH datamodel to the Unified Namespace (similar to the Historian feature)
- Configure your OEE calculation by adjusting the configuration table
- Open Grafana, select your equipment and select the analysis you want to have. More information can be found in the umh-datasource-v2.
For more information about what exactly is behind the Analytics feature, check out our our architecture page and our datamodel
What are the limitations?
At the moment, the limitations are:
- Speed losses in Performance are not calculated and can only be approximated using the LowSpeedThresholdInPcsPerHour configuration option
- There is no way of tracking losses through reworked products. Either a product is scrapped or not.
Where to get more information?
- Learn more about the benefits of using open-source databases in our blog article, Historians vs Open-Source databases - which is better?
- Learn more about the United Manufacturing Hub’s architecture by visiting our architecture page.
- Learn more about the datamodel by visiting our datamodel
- To build visual dashboards, check out our tutorial on using Grafana Canvas
2.4 - Alerting
The United Manufacturing Hub utilizes a TimescaleDB database, which is based on PostgreSQL. Therefore, you can use the PostgreSQL plugin in Grafana to implement and configure alerts and notifications.
Why should I use it?
Alerts based on real-time data enable proactive problem detection. For example, you will receive a notification if the temperature of machine oil or an electrical component of a production line exceeds limitations. By utilizing such alerts, you can schedule maintenance, enhance efficiency, and reduce downtime in your factories.
What can I do with it?
Grafana alerts help you keep an eye on your production and manufacturing processes. By setting up alerts, you can quickly identify problems, ensuring smooth operations and high-quality products. An example of using alerts is the tracking of the temperature of an industrial oven. If the temperature goes too high or too low, you will get an alert, and the responsible team can take action before any damage occurs. Alerts can be configured in many different ways, for example, to set off an alarm if a maximum is reached once or if it exceeds a limit when averaged over a time period. It is also possible to include several values to create an alert, for example if a temperature surpasses a limit and/or the concentration of a component is too low. Notifications can be sent simultaneously across many services like Discord, Mail, Slack, Webhook, Telegram, or Microsoft Teams. It is also possible to forward the alert with SMS over a personal Webhook. A complete list can be found on the Grafana page about alerting.
How can I use it?
Follow this tutorial to set up an alert.
Alert Rule
When creating an alert, you first have to set the alert rule in Grafana. Here you set a name, specify which values are used for the rule, and when the rule is fired. Additionally, you can add labels for your rules, to link them to the correct contact points. You have to use SQL to select the desired values.
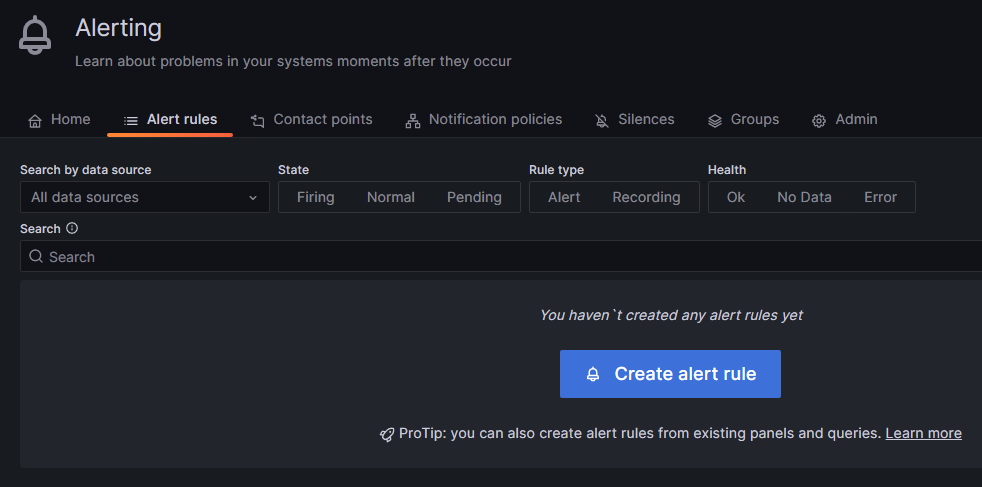
To add a new rule, hover over the bell symbol on the left and click on Alert rules. Then click on the blue Create alert rule button.
Choose a name for your rule.
In the next step, you need to select and manipulate the value that triggers your alert and declare the function for the alert.

Subsection A is, by default the selection of your values: You can use the Grafana builder for this, but it is not useful, as it cannot select a time interval even though there is a selector for it. If you choose, for example, the last 20 seconds, your query will select values from hours ago. Therefore, it is necessary to use SQL directly. To add command manually, switch to Code in the right corner of the section.
- First, you must select the value you want to create an alert for. In the United Manufacturing Hub’s data structure, a process value is stored in the table
tag. Unfortunately Grafana cannot differentiate between different values of the same sensor; if you select theConcentrationNH3value from the example and more than one of the selected values violates your rule in the selected time interval, it will trigger multiple alerts. Because Grafana is not able to tell the alerts apart, this results in errors. To solve this, you need to add the value"timestamp"to theSelectpart. So the first part of the SQL command is:SELECT value, "timestamp". - The source is
tag, so addFROM tagat the end.
- The different values are distinguished by the variable
namein thetag, so addWHERE name = '<key-name>'to select only the value you need. If you followed Get Started guide, you can usetemperatureas the name. - Since the selection of the time interval in Grafana is not working, you must add this manually as an addition to the
WHEREcommand:AND "timestamp" > (NOW() - INTERVAL 'X seconds').Xis the number of past seconds you want to query. It’s not useful to setXto less than 10 seconds, as this is the fastest interval Grafana can check your rule, and you might miss values.
The complete command is:
SELECT value, "timestamp" FROM tag WHERE name = 'temperature' AND "timestamp" > (NOW() - INTERVAL '10 seconds')- First, you must select the value you want to create an alert for. In the United Manufacturing Hub’s data structure, a process value is stored in the table
In subsection B, you need to reduce the values to numbers, Grafana can work with. By default, Reduce will already be selected. However, you can change it to a different option by clicking the pencil icon next to the letter B. For this example, we will create an upper limit. So selecting Max as the Function is the best choice. Set Input as A (the output of the first section) and choose Strict for the Mode. So subsection B will output the maximum value the query in A selects as a single number.
In subsection C, you can establish the rule. If you select Math, you can utilize expressions like
$B > 120to trigger an alert when a value from section B ($Bmeans the output from section B) exceeds 50. In this case, only the largest value selected in A is passed through the reduce function from B to C. A simpler way to set such a limit is by choosing Threshold instead of Math.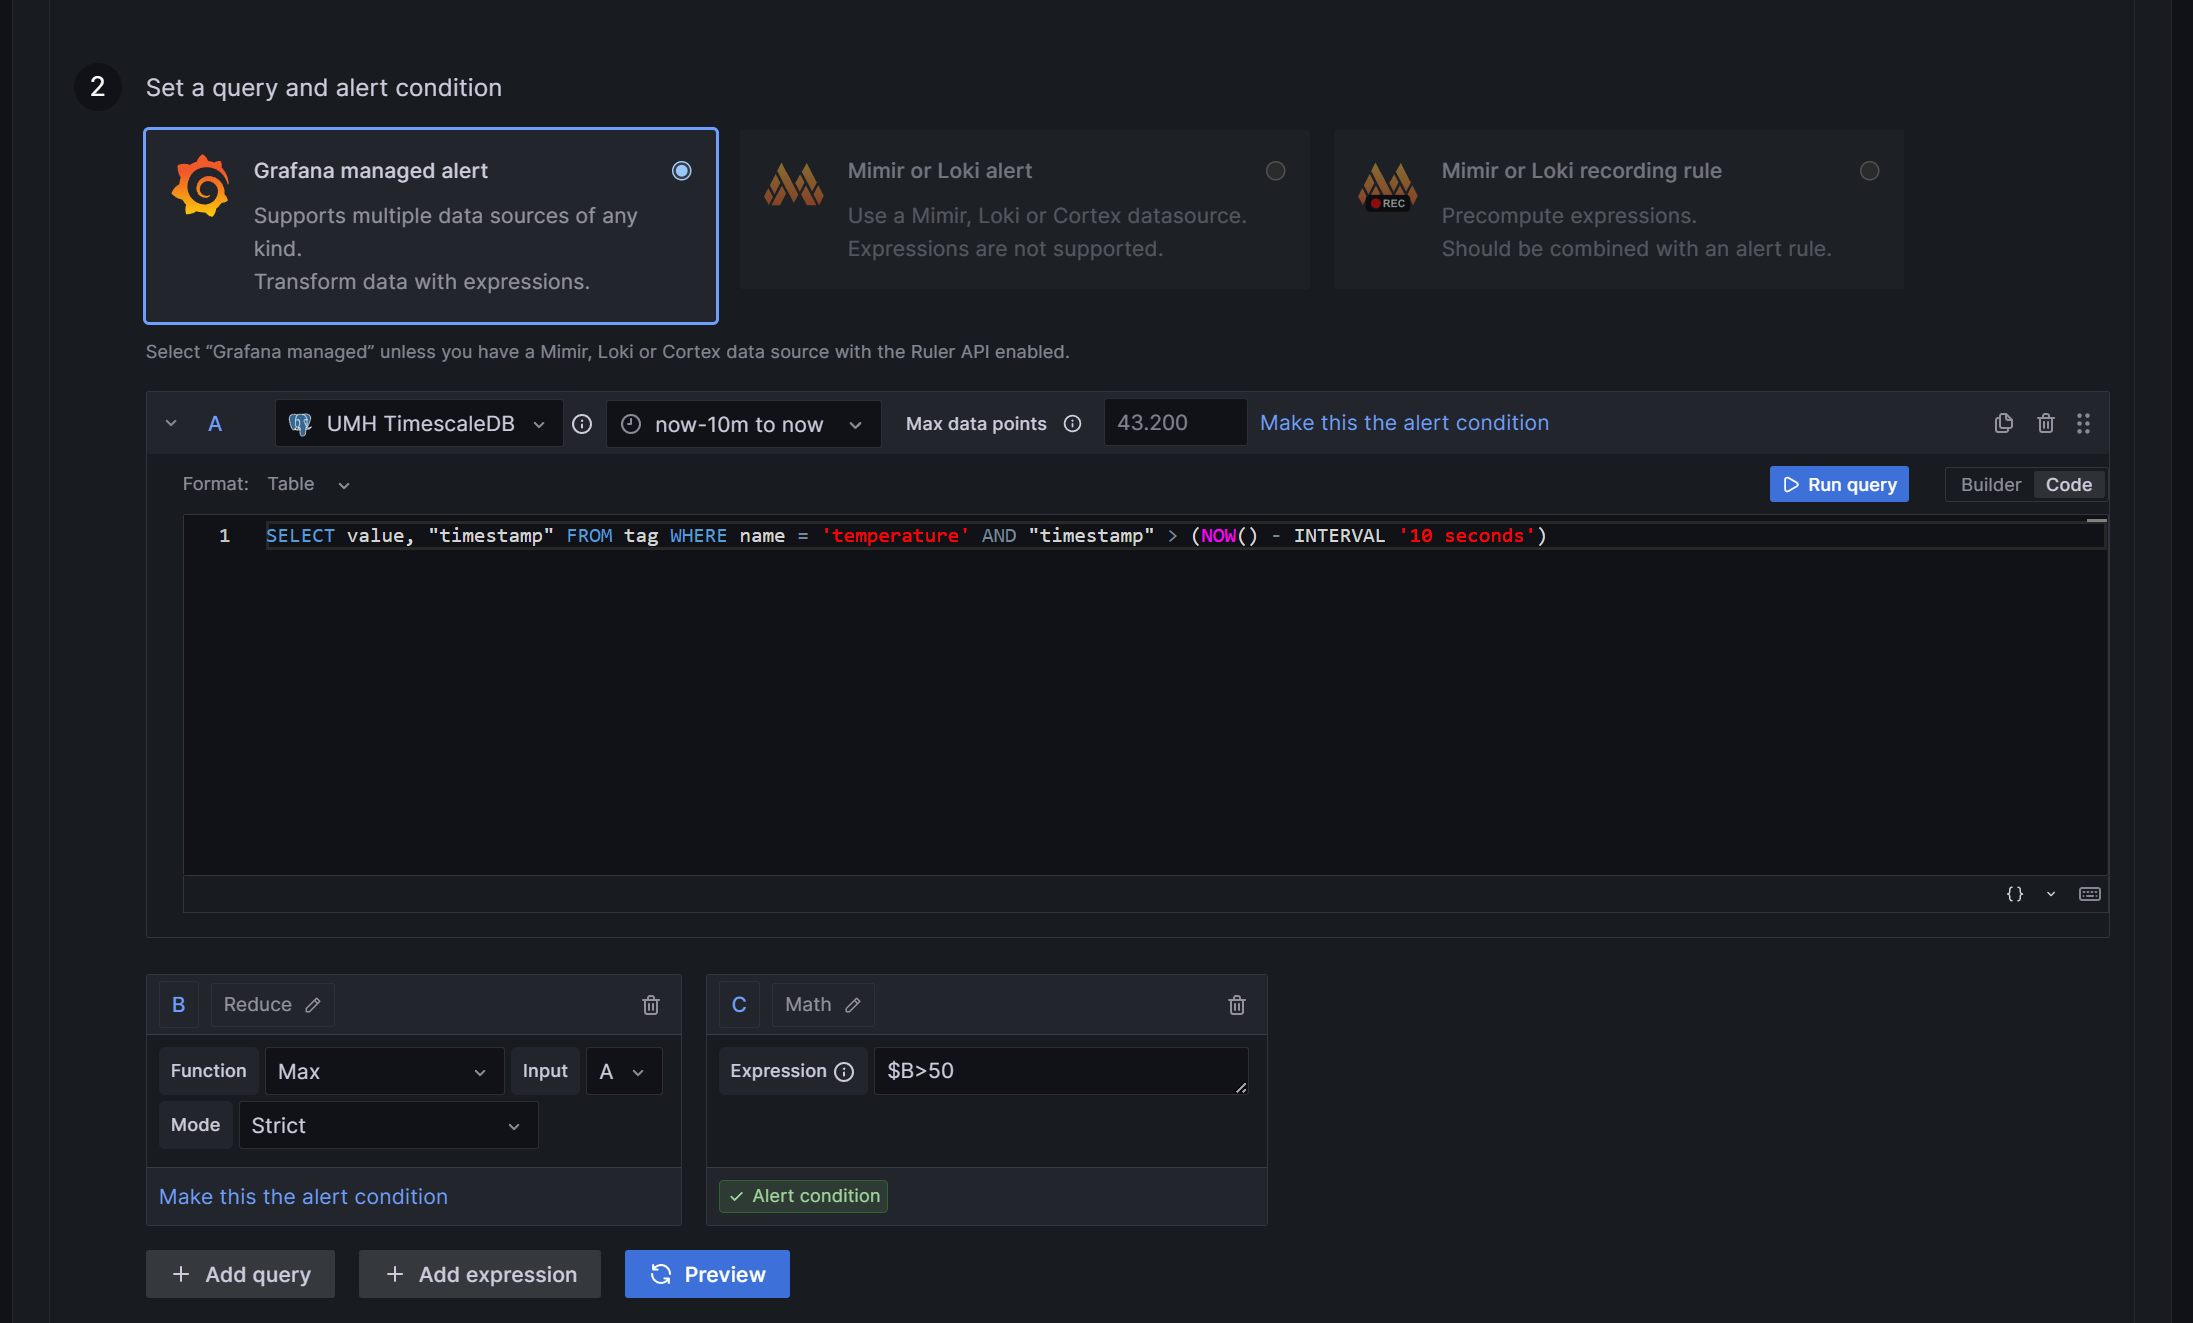
To add more queries or expressions, find the buttons at the end of section two and click on the desired option. You can also preview the results of your queries and functions by clicking on Preview and check if they function correctly and fire an alert.

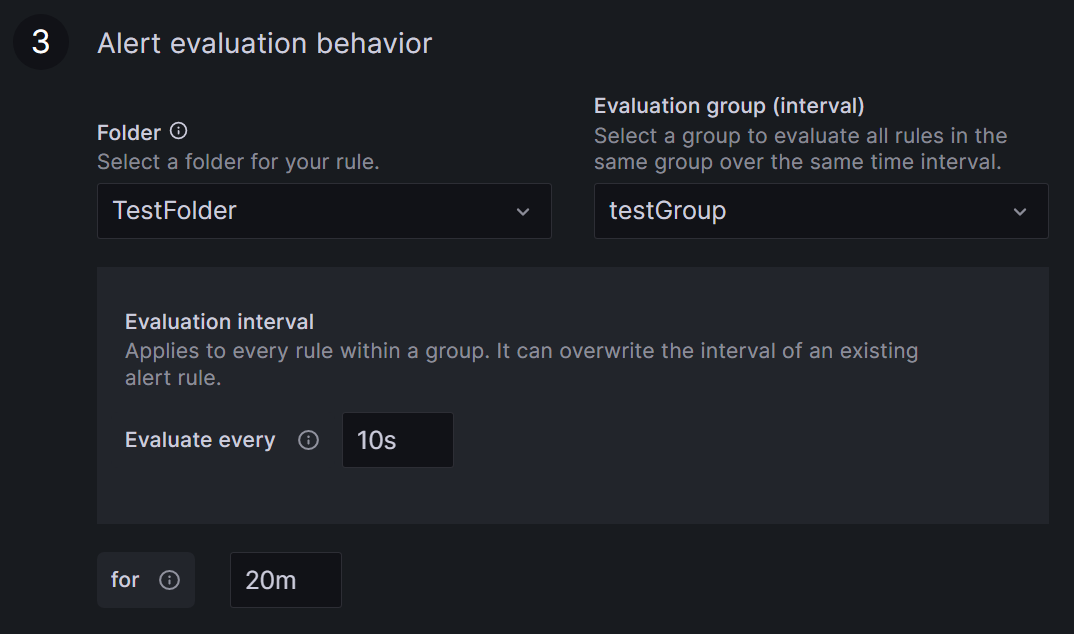
Define the rule location, the time interval for rule checking, and the duration for which the rule has to be broken before an alert is triggered.
Select a name for your rule’s folder or add it to an existing one by clicking the arrow. Find all your rules grouped in these folders on the Alert rules page under Alerting.
An Evaluation group is a grouping of rules, which are checked after the same time interval. Creating a new group requires setting a time interval for rule checking. The minimum interval from Grafana is ten seconds.
Specify the duration the rule must be violated before triggering the alert. For example, with a ten-second check interval and a 20-second duration, the rule must be broken twice in a row before an alert is fired.
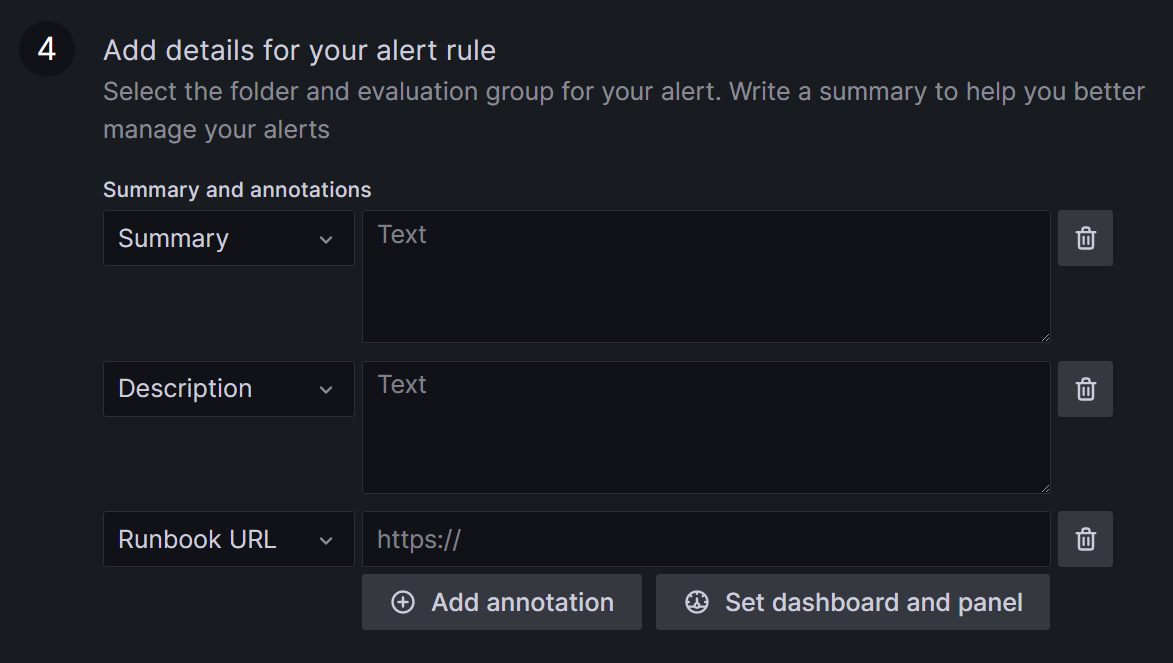
Add details and descriptions for your rule.
In the next step, you will be required to assign labels to your alert, ensuring it is directed to the appropriate contacts. For example, you may designate a label team with alertrule1:
team = operatorand alertrule2:team = management. It can be helpful to use labels more than once, like alertrule3:team = operator, to link multiple alerts to a contact point at once.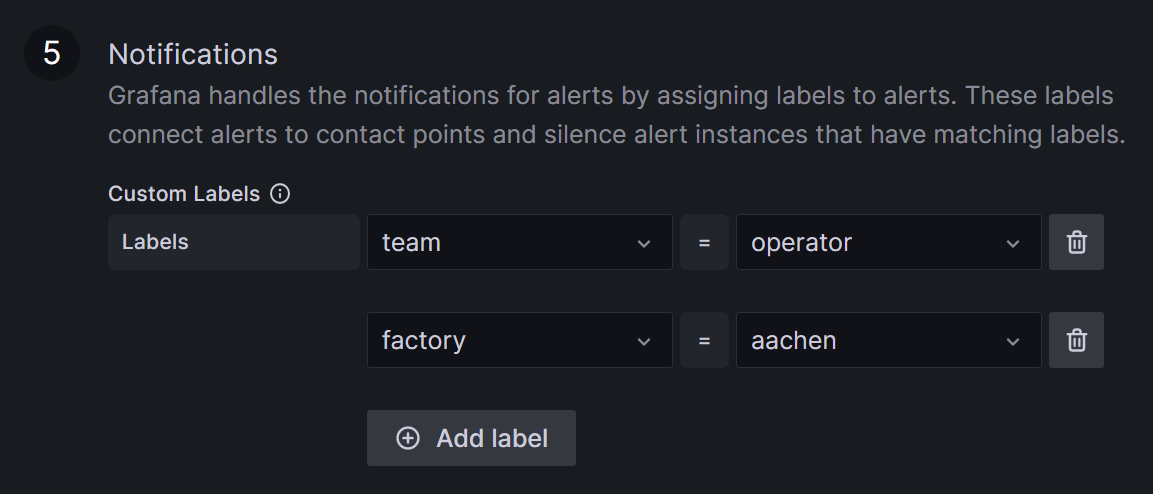


Your rule is now completed; click on Save and Exit on the right upper corner, next to section one.
Contact Point
In a contact point you create a collection of addresses and services that should be notified in case of an alert. This could be a Discord channel or Slack for example. When a linked alert is triggered, everyone within the contact point receives a message. The messages can be preconfigured and are specific to every service or contact. The following steps shall be done to create a contact point.
Navigate to Contact points, located at the top of the Grafana alerting page.
Click on the blue + Add contact point button.
Now, you should be able to see setting page. Choose a name for your contact point.
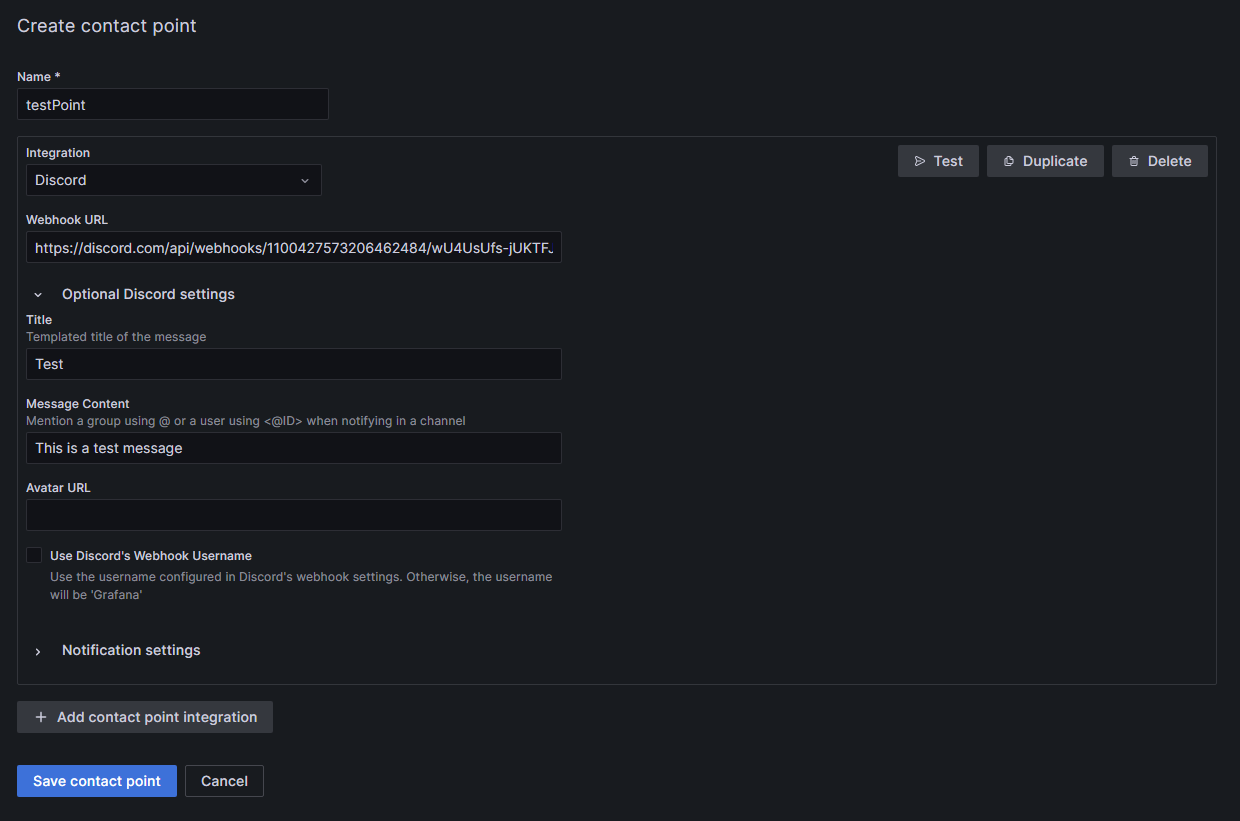
Pick the receiving service; in this example, Discord.
Generate a new Webhook in your Discord server (Server Settings ⇒ Integrations ⇒ View Webhooks ⇒ New Webhook or create Webhook). Assign a name to the Webhook and designate the messaging channel. Copy the Webhook URL from Discord and insert it into the corresponding field in Grafana. Customize the message to Discord under Optional Discord settings if desired.
If you need, add more services to the contact point, by clicking + Add contact point integration.
Save the contact point; you can see it in the Contact points list, below the grafana-default-email contact point.

Notification Policies
In a notification policy, you establish the connection of a contact point with the desired alerts. To add the notification policy, you need to do the following steps.
Go to the Notification policies section in the Grafana alerting page, next to the Contact points.
Select + New specific policy to create a new policy, followed by + Add matcher to choose the label and value from the alert (for example
team = operator). In this example, both alert1 and alert3 will be forwarded to the associated contact point. You can include multiple labels in a single notification policy.Choose the contact point designated to receive the alert notifications. Now, the inputs should be like in the picture.
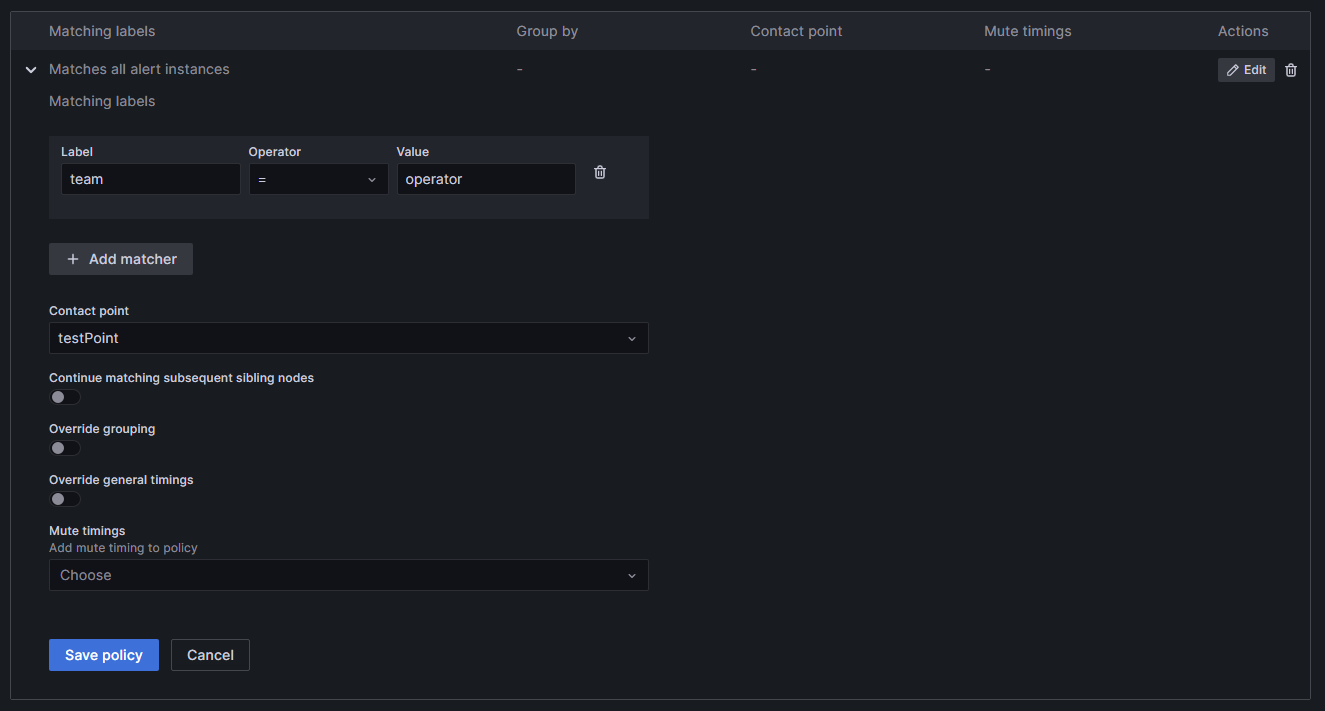
Press Save policy to finalize your settings. Your new policy will now be displayed in the list.

Mute Timing
In case you do not want to receive messages during a recurring time period, you can add a mute timing to Grafana. You can set up a mute timing in the Notification policies section.
Select + Add mute timing below the notification policies.
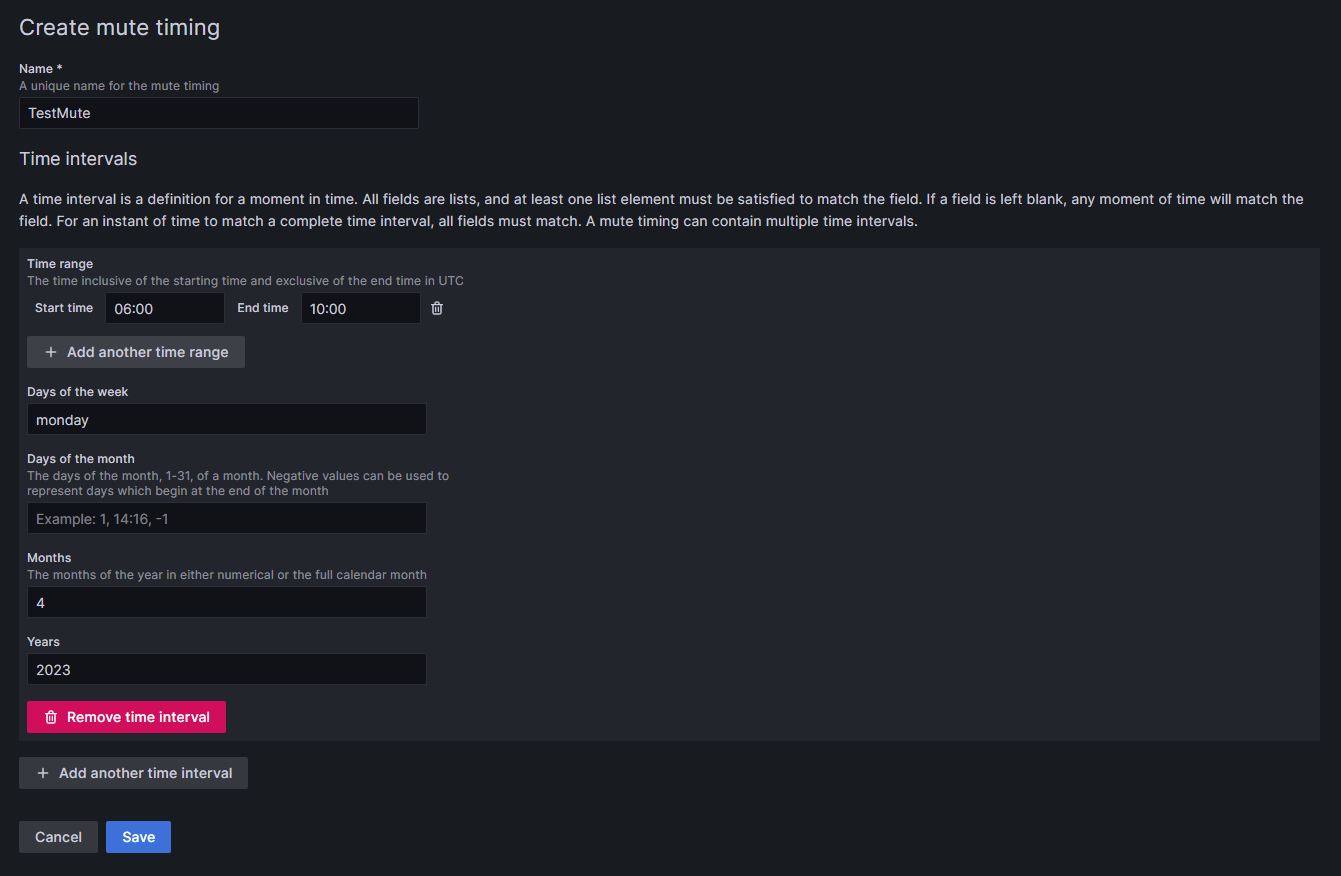
Choose a name for the mute timing.
Specify the time during which notifications should not be forwarded.
- Time has to be given in UTC time and formatted as HH:MM. Use 06:00 instead of 6:00 to avoid an error in Grafana.
You can combine several time intervals into one mute timing by clicking on the + Add another time interval button at the end of the page.
Click Submit to save your settings.
To apply the mute timing to a notification policy, click Edit on the right side of the notification policy, and then select the desired mute timing from the drop-down menu at the bottom of the policy. Click on Save Policy to apply the change.

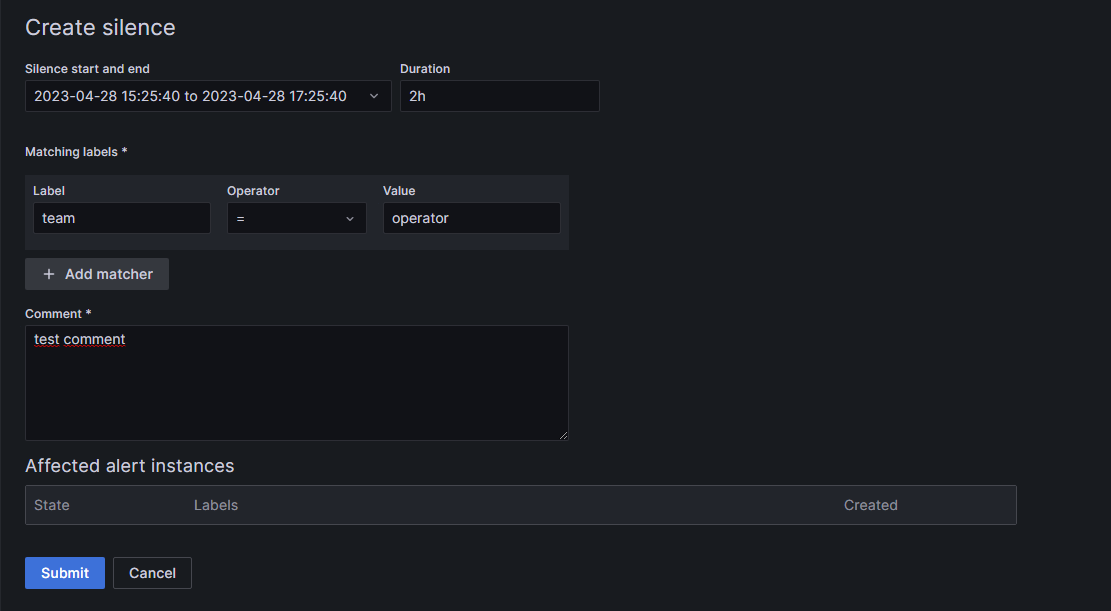
Silence
You can also add silences for a specific time frame and labels, in case you only want to mute alerts once. To add a silence, switch to the Silences section, next to Notification policies.
Click on + Add Silence.
Specify the beginning for the silence and its duration.
Select the labels and their values you want silenced.
If you need, you can add a comment to the silence.
Click the Submit button at the bottom of the page.

What are the limitations?
It can be complicated to select and manipulate the desired values to create the correct function for your application. Grafana cannot differentiate between data points of the same source. For example, you want to make a temperature threshold based on a single sensor. If your query selects the last three values and two of them are above the threshold, Grafana will fire two alerts which it cannot tell apart. This results in errors. You have to configure the rule to reduce the selected values to only one per source to avoid this. It can be complicated to create such a specific rule with this limitation, and it requires some testing.
Another thing to keep in mind is that the alerts can only work with data from the database. It also does not work with the machine status; these values only exist in a raw, unprocessed form in TimescaleDB and are not processed through an API like process values.
Where to get more information?
3 - Device & Container Infrastructure
3.1 - Provisioning
The Management Console simplifies the deployment of the Data Infrastructure on any existing system. You can also provision the entire Device & Container Infrastructure, with a little manual interaction.
When should I use it?
Whether you have a bare metal server, and edge device, or a virtual machine, you can easily provision the whole United Manufacturing Hub. Choose to deploy only the Data Infrastructure on an existing OS, or provision the entire Device & Container Infrastructure, OS included.
What can I do with it?
You can leverage our custom iPXE bootstrapping process to install the flatcar operating system, along with the Device & Container Infrastructure and the Data Infrastructure.
If you already have an operating system installed, you can use the Management Console to provision the Data Infrastructure on top of it. You can also choose to use an existing UMH installation and only connect it to the Management Console.

How can I use it?
If you need to install the operating system from scratch, you can follow the Flatcar Installation guide, which will help you to deploy the default version of the United Manufacturing Hub.
Contact our Sales Team to get help on customizing the installation process in order to fit your enterprise needs.
If you already have an operating system installed, you can follow the Getting Started guide to provision the Data Infrastructure and setup the Management Companion agent on your system.
What are the limitations?
- Provisioning the Device & Container Infrastructure requires manual interaction and is not yet available from the Management Console.
- ARM systems are not supported.
Where to get more information?
- The Get Started! guide assists you to set up the United Manufacturing Hub.
- Learn more about the Data Infrastructure.
- Take a look at the Device & Container Infrastructure.
3.2 - Monitoring & Management
The Management Console supports you to monitor and manage the Data Infrastructure and the Device & Container Infrastructure.
When should I use it?
Once initial deployment of the United Manufacturing Hub is completed, you can monitor and manage it using the Management Console. If you have not deployed yet, navigate to the Get Started! guide.
What can I do with it?
You can monitor the statuses of the following items using the Management Console:
- Modules: A Module refers to a grouped set of related Kubernetes components like Pods, StatefulSets, and Services. It provides a way to monitor and manage these components as a single unit.
- System:
- Resource Utilization: CPU, RAM, and DISK usages.
- OS information: the used operating system, kernel version, and instruction set architecture.
- Datastream: the rate of Kafka/TimescaleDB messages per second, the health of both connections and data sources.
- Kubernetes: the number of error events and the deployed management companion’s and UMH’s versions.
In addition, you can check the topic structure used by data sources and the corresponding payloads.
Moreover, you can create a new connection and initialize the created connection to deploy a data source.
How can I use it?
From the Component View, in the overview tab, you can click and open each status on this tab.

The Connection Management tab shows the status of all the instance’s connections and their associated data sources. Moreover, you can create a new connection, as well as initialize them. Read more about the Connection Management in the Connectivity section.

The Tag Browser provides a comprehensive view of the tag structure, allowing automation engineers to manage and navigate through all their tags without concerning themselves with underlying technical complexities, such as topics, keys or payload structures.
Tags typically represent variables associated with devices in an ISA-95 model. For instance, it could represent a temperature reading from a specific sensor or a status indication from a machine component. These tags are transported through various technical methods across the Unified Namespace (UNS) into the database. This includes organizing them within a folder structure or embedding them as JSON objects within the message payload. Tags can be sent into the same topic or utilizing various sub-topics. Due to the nature of MQTT and Kafka, the topics may differ, but the following formula applies:
MQTT Topic = Kafka topic + Kafka Key
The Kafka topic and key depend on the configured merge point, read more about it here.
Read more about the Tag Browser in the Unified Namespace section.
What are the limitations?
Presently, removing a UMH instance from the Management Console is not supported. After overwriting an instance, the old one will display an offline status.
Where to get more information?
- The Get Started! guide assists you to set up the United Manufacturing Hub.
- Learn more about the Data Infrastructure.
- Take a look at the Device & Container Infrastructure.
3.3 - UMH Lite
If you are already using Unified Namespace, or have a Kafka / MQTT broker, you might want to try out the basic features of UMH. For this purpose, the UMH Lite installation is available.
When should I use it?
If you want the full-featured UMH experience, we recommend installing the Classic version. This version provides a comprehensive suite of features, including analytics, data visualization, message brokers, alerting, and more. Below, you can see a comparison of the features between the two versions.
What can I do with it?
Differences between UMH Classic and Lite
| Feature | Classic | Lite |
|---|---|---|
| Connectivity | ||
| OPC UA | ✓ | ✓ |
| Node-RED | ✓ | |
| Data Infrastructure | ||
| Historian | ✓ | |
| Analytics | ✓ | |
| Data Visualization | ✓ | |
| UNS (Kafka and MQTT) | ✓ | |
| Alerting | ✓ | |
| UMH Data Model v1 | ✓ | ✓ |
| Tag Browser for your UNS | ✓ | |
| Device & Container Infrastructure | ||
| Network Monitoring | ✓ | ✓ |
Connect devices and add protocol converters
You can connect external devices like a PLC with an OPC UA server to a running UMH Lite instance and contextualize the data from it with a protocol converter. For contextualization, you have to use the UMH Data Model v1.
Send data to your own infrastructure
All the data that your instance is gathering is sent to your own data infrastructure. You can configure a target MQTT broker in the instance settings by clicking on it in the Management Console.
Monitor your network health
By using the UMH Lite in conjunction with the Management Console, you can spot errors in the network. If a connection is faulty, the Management Console will mark it.
How can I use it?
To add a new UMH Lite instance, simply follow the regular installation process and select UMH Lite instead of UMH Classic. You can follow the next steps in the linked guide to learn how to connect devices and add a protocol converter.
Convert to UMH Classic
Should you find the UMH Lite insufficient and require the features offered by UMH Classic, you can upgrade through the Management Console. To convert a UMH Lite instance to a UMH Classic instance:
- Go to the Management Console.
- Navigate to Component View.
- Select the instance from the list.
- Click on ‘Instance Settings’.
- You will find an option to convert your instance to Classic.
This change will preserve the configurations of your devices and protocol converters: Their data continues to be forwarded to your initial MQTT broker, while also becoming accessible within your new Unified Namespace and database.
Any protocol converters introduced post-upgrade will also support the original MQTT broker as an additional output. You can manually remove the original MQTT broker as an output after the upgrade. Once removed, data will no longer be forwarded to the initial MQTT broker.
What are the limitations?
The UMH Lite is a very basic version and only offers you the gathering and contextualization of your data as well as the monitoring of the network. Other features like a historian, data visualization, and a Unified Namespace are only available by using the UMH Classic.
Additionally, converting to a UMH Classic requires an SSH connection, similar to what is needed during the initial installation.
Where to get more information?
- Learn how to install UMH Lite.
- Learn how to gather your data.
- Read about our Data Model to keep your data organized and contextualized.
3.4 - Layered Scaling
Layered Scaling is an architectural approach in the United Manufacturing Hub that enables efficient scaling of your deployment across edge devices and servers. It is part of the Plant centric infrastructure , by dividing the processing workload across multiple layers or tiers, each with a specific set of responsibilities, Layered Scaling allows for better management of resources, improved performance, and easier deployment of software components. Layered Scaling follows the standard IoT infrastructure, by additionally connection a lot of IoT-devices typically via MQTT.

When should I use it?
Layered Scaling is ideal when:
- You need to process and exchange data close to the source for latency reasons and independence from internet and network outages. For example, if you are taking pictures locally, analyzing them using machine learning, and then scrapping the product if the quality is poor. In this case, you don’t want the machine to be idle if something happens in the network. Also, it would not be acceptable for a message to arrive a few hundred milliseconds later, as the process is quicker than that.
- High-frequency data might be useful to not send to the “higher” instance and store there. It can put unnecessary stress on those instances. You have an edge device that takes care of it. For example, you are taking and processing images (e.g., for quality reasons) or using an accelerometer and microphone for predictive maintenance reasons on the machine and do not want to send data streams with 20 kHz (20,000 times per second) to the next instance.
- Organizational reasons. For the OT person, it might be better to configure the data contextualization using Node-RED directly at the production machine. They could experiment with it, configure it without endangering other machines, and see immediate results (e.g., when they move the position of a sensor). If the instance is “somewhere in IT,” they may feel they do not have control over it anymore and that it is not their system.
What can I do with it?
With Layered Scaling in the United Manufacturing Hub, you can:
- Deploy minimized versions of the Helm Chart on edge devices, focusing on specific features required for that environment (e.g., without the Historian and Analytics features enabled, but with the IFM retrofitting feature using sensorconnect, with the barcodereader retrofit feature using barcodereader, or with the data connectivity via Node-RED feature enabled).
- Seamlessly communicate between edge devices, on-premise servers, and cloud instances using the kafka-bridge microservice, allowing data to be buffered in between in case the internet or network connection drops.
- Allow plant-overarching analysis / benchmarking, multi-plant kpis, connections to enterprise-IT, etc.. We typically recommend sending only data processed by our API factoryinsight.
How can I use it?
To implement Layered Scaling in the United Manufacturing Hub:
- Deploy a minimized version of the Helm Chart on edge devices, tailored to the specific features required for that environment. You can either install the whole version using flatcar and then disable functionalities you do not need, or use the Management Console. If the feature is not available in the Management Console, you could try asking nicely in the Discord and we will, can provide you with a token you can enter during the flatcar installation, so that your edge devices are pre-configured depending on your needs (incl. demilitarized zones, multiple networks, etc.)
- Deploy the full Helm Chart with all features enabled on a central instance, such as a server.
- Configure the Kafka Bridge microservice to transmit data from the edge devices to the central instance for further processing and analysis.
For MQTT connections, you can just connect external devices via MQTT, and it will land up in kafka directly. To connect on-premise servers with the cloud (plant-overarching architecture), you can use kafka-bridge or write service in benthos or Node-RED that regularly fetches data from factoryinsight and pushes it into your cloud instance.
What are the limitations?
- Be aware that each device increases the complexity over the entire system. We recommend using the Management Console to manage them centrally.
Because Kafka is used to reliably transmit messages from the edge devices to the server, and it struggles with devices repeatedly going offline and online again, ethernet connections should be used. Also, the total amount of edge devices should not “escalate”. If you have a lot of edge devices (e.g., you want to connect each PLC), we recommend connecting them via MQTT to an instance of the UMH instead.
Where to get more information?
- Learn more about the United Manufacturing Hub’s architecture by visiting our architecture page.
- For more information about the Helm Chart and how to deploy it, refer to the Helm Chart documentation.
- To get an overview of the microservices in the United Manufacturing Hub, check out the microservices documentation.
3.5 - Upgrading
Upgrading is a vital aspect of maintaining your United Manufacturing Hub (UMH) instance. This feature ensures that your UMH environment stays current, secure, and optimized with the latest enhancements. Explore the details below to make the most of the upgrading capabilities.
When Should I Use It?
Upgrade your UMH instance whenever a new version is released to access the latest features, improvements, and security enhancements. Regular upgrades are recommended for a seamless experience.
What Can I Do With It?
Enhance your UMH instance in the following ways:
- Keep it up-to-date with the latest features and improvements.
- Enhance security and performance.
- Take advantage of new functionalities and optimizations introduced in each release.
How Can I Use It?
To upgrade your UMH instance, follow the detailed instructions provided in the Upgrading Guide.
What Are The Limitations?
- As of now, the upgrade process for the UMH stack is not integrated into the Management Console and must be performed manually.
- Ensure compatibility with the recommended prerequisites before initiating an upgrade.