Alerting
10 minute read
The United Manufacturing Hub utilizes a TimescaleDB database, which is based on PostgreSQL. Therefore, you can use the PostgreSQL plugin in Grafana to implement and configure alerts and notifications.
Why should I use it?
Alerts based on real-time data enable proactive problem detection. For example, you will receive a notification if the temperature of machine oil or an electrical component of a production line exceeds limitations. By utilizing such alerts, you can schedule maintenance, enhance efficiency, and reduce downtime in your factories.
What can I do with it?
Grafana alerts help you keep an eye on your production and manufacturing processes. By setting up alerts, you can quickly identify problems, ensuring smooth operations and high-quality products. An example of using alerts is the tracking of the temperature of an industrial oven. If the temperature goes too high or too low, you will get an alert, and the responsible team can take action before any damage occurs. Alerts can be configured in many different ways, for example, to set off an alarm if a maximum is reached once or if it exceeds a limit when averaged over a time period. It is also possible to include several values to create an alert, for example if a temperature surpasses a limit and/or the concentration of a component is too low. Notifications can be sent simultaneously across many services like Discord, Mail, Slack, Webhook, Telegram, or Microsoft Teams. It is also possible to forward the alert with SMS over a personal Webhook. A complete list can be found on the Grafana page about alerting.
How can I use it?
Follow this tutorial to set up an alert.
Alert Rule
When creating an alert, you first have to set the alert rule in Grafana. Here you set a name, specify which values are used for the rule, and when the rule is fired. Additionally, you can add labels for your rules, to link them to the correct contact points. You have to use SQL to select the desired values.
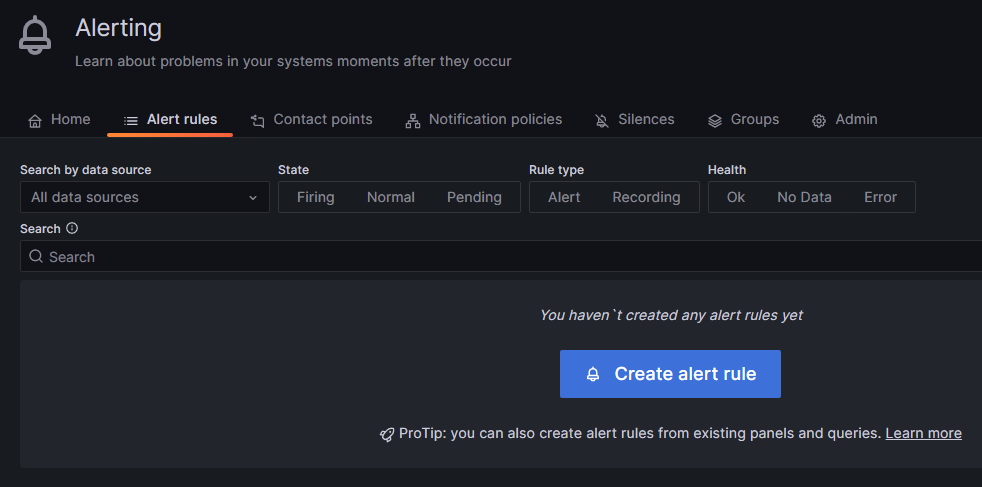
To add a new rule, hover over the bell symbol on the left and click on Alert rules. Then click on the blue Create alert rule button.
Choose a name for your rule.
In the next step, you need to select and manipulate the value that triggers your alert and declare the function for the alert.

Subsection A is, by default the selection of your values: You can use the Grafana builder for this, but it is not useful, as it cannot select a time interval even though there is a selector for it. If you choose, for example, the last 20 seconds, your query will select values from hours ago. Therefore, it is necessary to use SQL directly. To add command manually, switch to Code in the right corner of the section.
- First, you must select the value you want to create an alert for. In the United Manufacturing Hub’s data structure, a process value is stored in the table
tag. Unfortunately Grafana cannot differentiate between different values of the same sensor; if you select theConcentrationNH3value from the example and more than one of the selected values violates your rule in the selected time interval, it will trigger multiple alerts. Because Grafana is not able to tell the alerts apart, this results in errors. To solve this, you need to add the value"timestamp"to theSelectpart. So the first part of the SQL command is:SELECT value, "timestamp". - The source is
tag, so addFROM tagat the end.
- The different values are distinguished by the variable
namein thetag, so addWHERE name = '<key-name>'to select only the value you need. If you followed Get Started guide, you can usetemperatureas the name. - Since the selection of the time interval in Grafana is not working, you must add this manually as an addition to the
WHEREcommand:AND "timestamp" > (NOW() - INTERVAL 'X seconds').Xis the number of past seconds you want to query. It’s not useful to setXto less than 10 seconds, as this is the fastest interval Grafana can check your rule, and you might miss values.
The complete command is:
SELECT value, "timestamp" FROM tag WHERE name = 'temperature' AND "timestamp" > (NOW() - INTERVAL '10 seconds')- First, you must select the value you want to create an alert for. In the United Manufacturing Hub’s data structure, a process value is stored in the table
In subsection B, you need to reduce the values to numbers, Grafana can work with. By default, Reduce will already be selected. However, you can change it to a different option by clicking the pencil icon next to the letter B. For this example, we will create an upper limit. So selecting Max as the Function is the best choice. Set Input as A (the output of the first section) and choose Strict for the Mode. So subsection B will output the maximum value the query in A selects as a single number.
In subsection C, you can establish the rule. If you select Math, you can utilize expressions like
$B > 120to trigger an alert when a value from section B ($Bmeans the output from section B) exceeds 50. In this case, only the largest value selected in A is passed through the reduce function from B to C. A simpler way to set such a limit is by choosing Threshold instead of Math.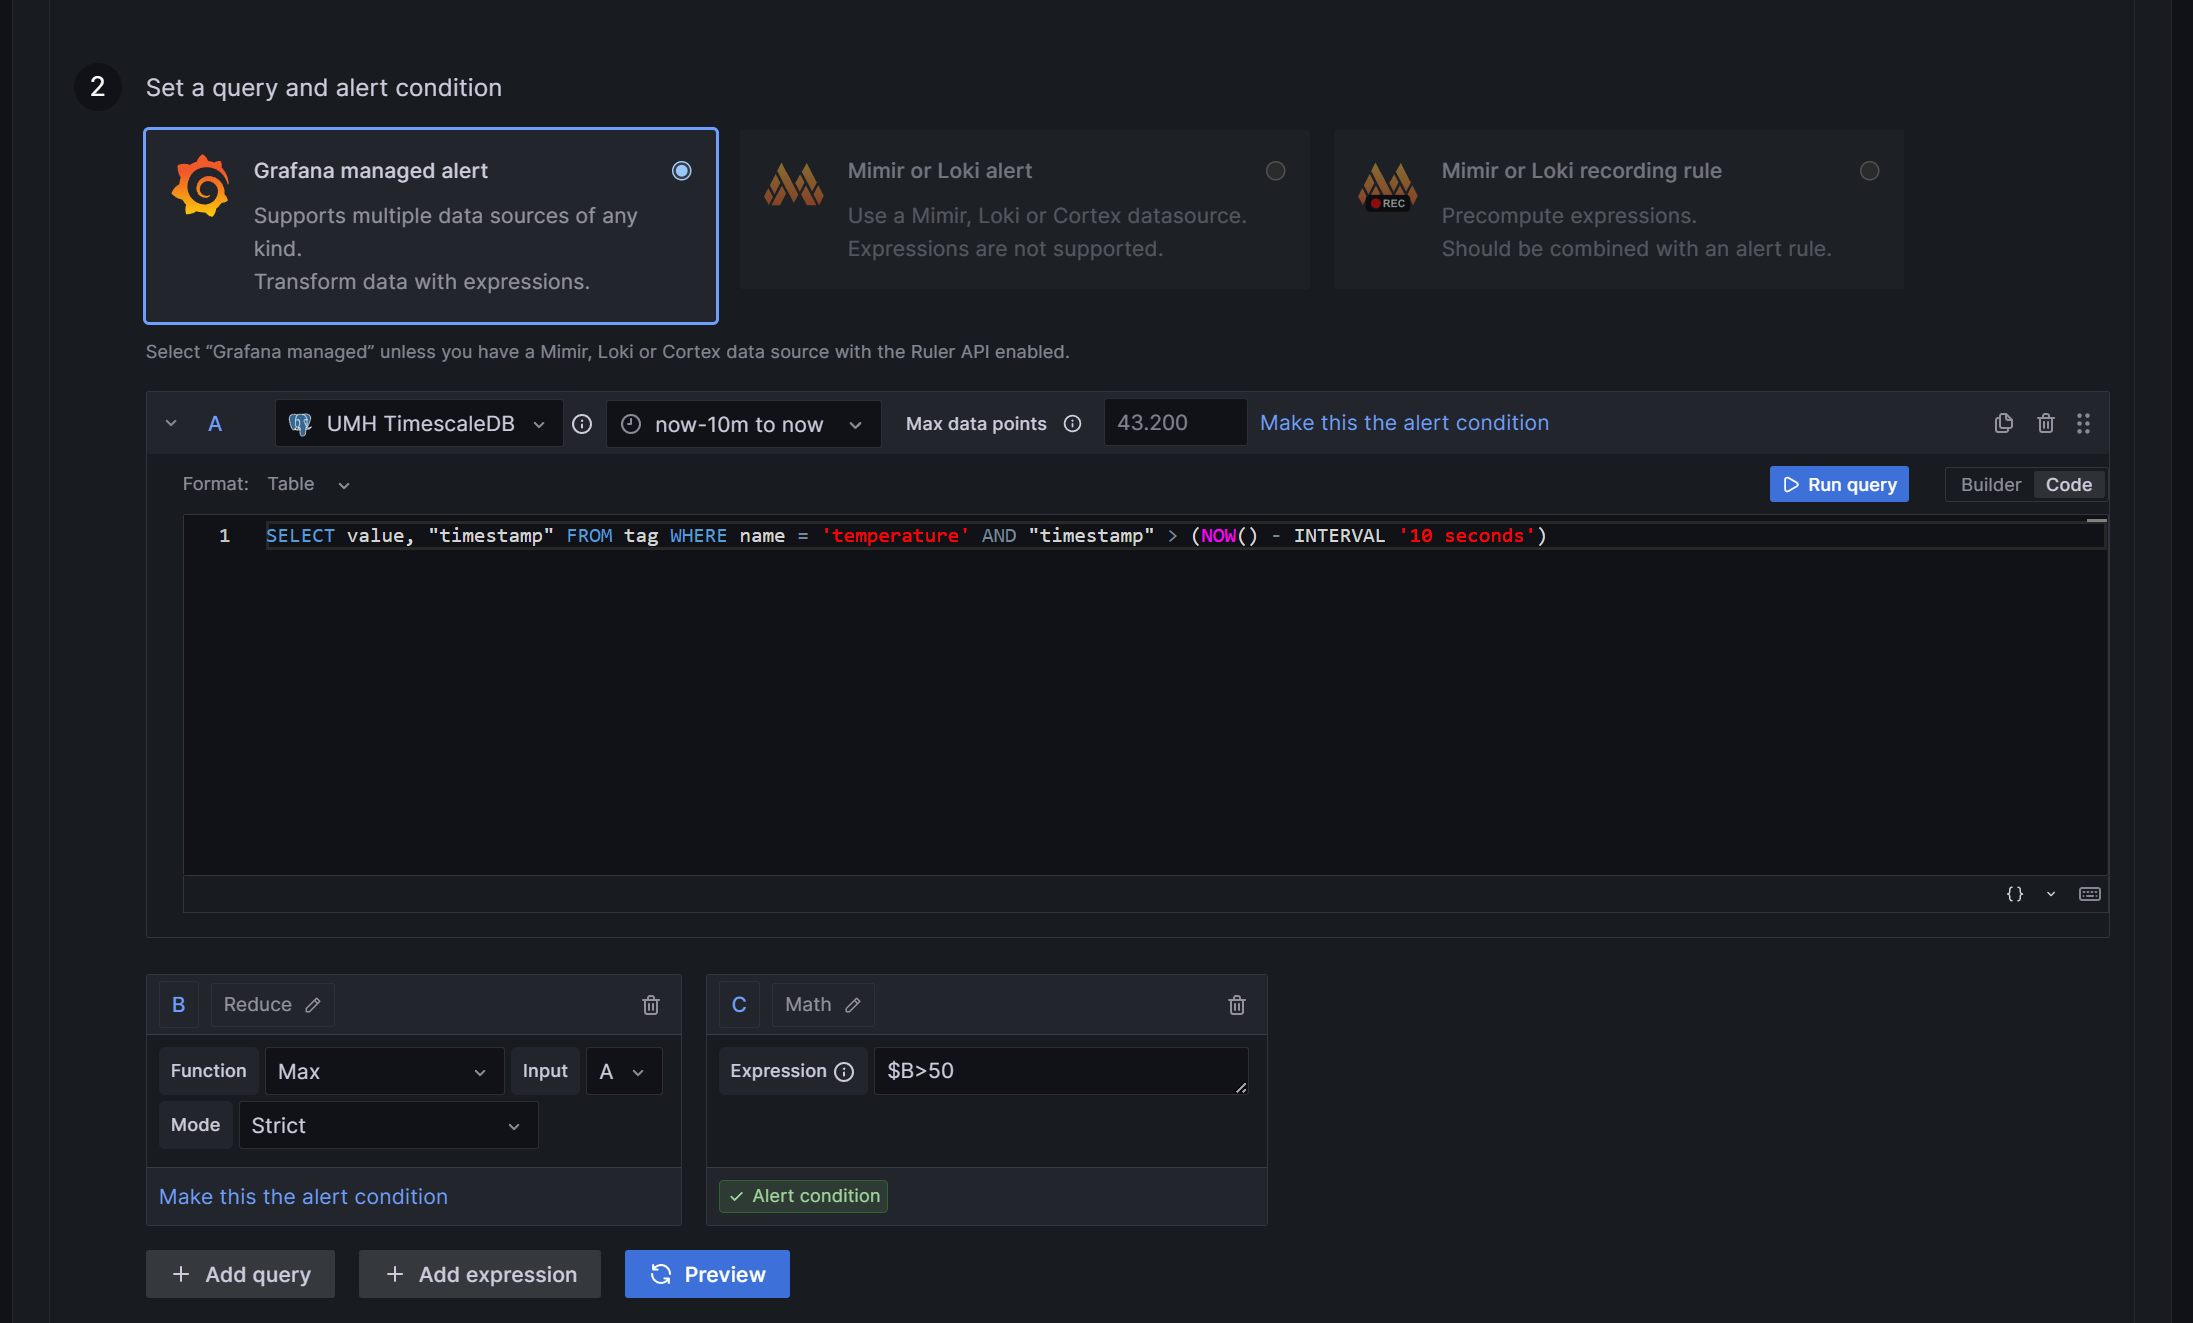
To add more queries or expressions, find the buttons at the end of section two and click on the desired option. You can also preview the results of your queries and functions by clicking on Preview and check if they function correctly and fire an alert.

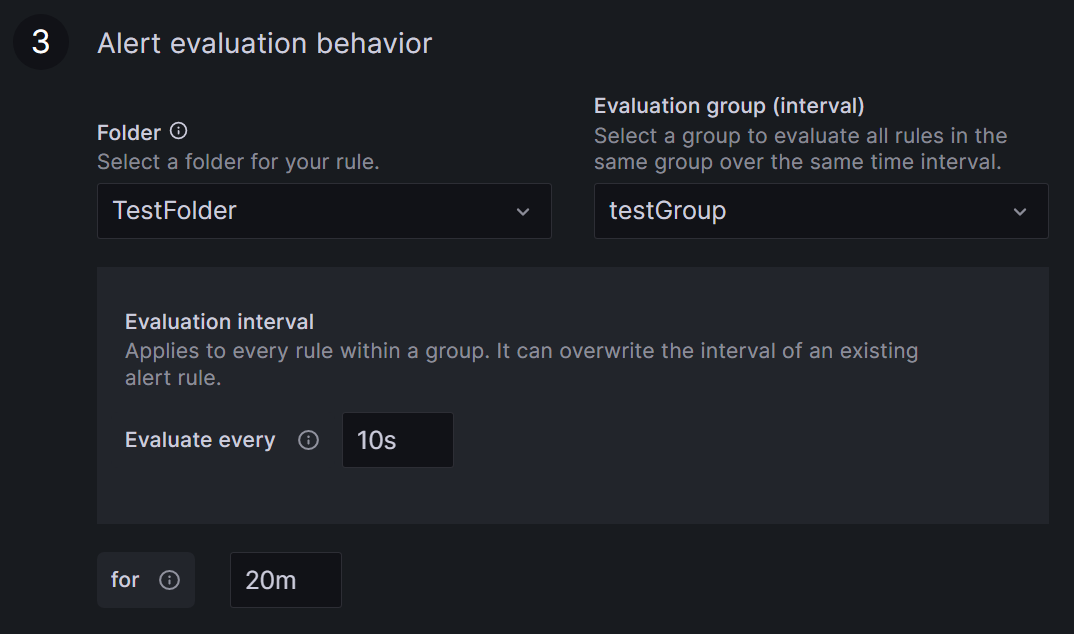
Define the rule location, the time interval for rule checking, and the duration for which the rule has to be broken before an alert is triggered.
Select a name for your rule’s folder or add it to an existing one by clicking the arrow. Find all your rules grouped in these folders on the Alert rules page under Alerting.
An Evaluation group is a grouping of rules, which are checked after the same time interval. Creating a new group requires setting a time interval for rule checking. The minimum interval from Grafana is ten seconds.
Specify the duration the rule must be violated before triggering the alert. For example, with a ten-second check interval and a 20-second duration, the rule must be broken twice in a row before an alert is fired.
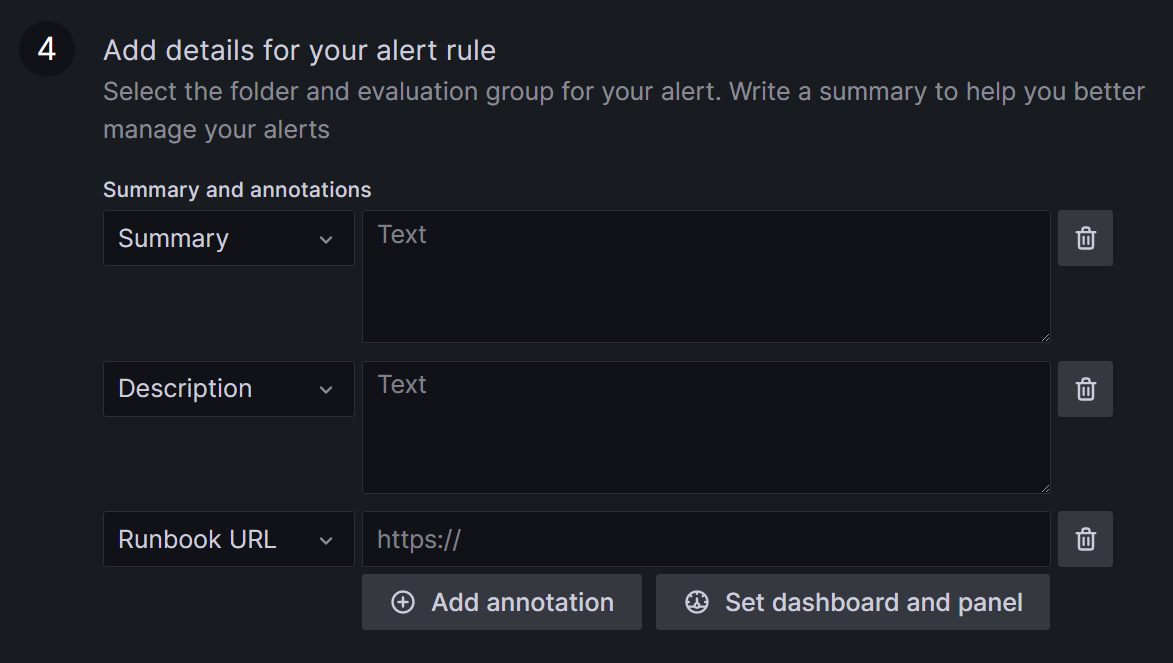
Add details and descriptions for your rule.
In the next step, you will be required to assign labels to your alert, ensuring it is directed to the appropriate contacts. For example, you may designate a label team with alertrule1:
team = operatorand alertrule2:team = management. It can be helpful to use labels more than once, like alertrule3:team = operator, to link multiple alerts to a contact point at once.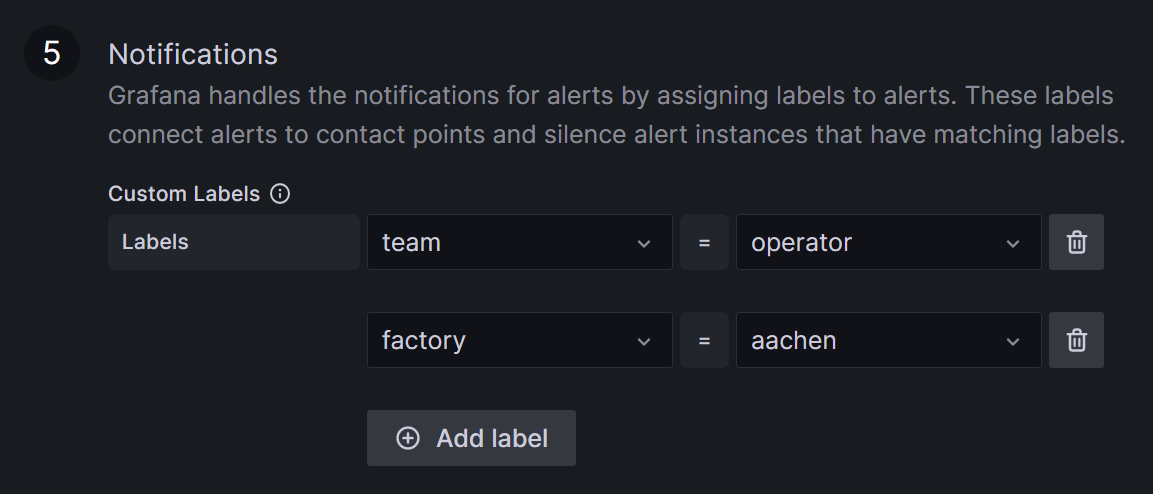


Your rule is now completed; click on Save and Exit on the right upper corner, next to section one.
Contact Point
In a contact point you create a collection of addresses and services that should be notified in case of an alert. This could be a Discord channel or Slack for example. When a linked alert is triggered, everyone within the contact point receives a message. The messages can be preconfigured and are specific to every service or contact. The following steps shall be done to create a contact point.
Navigate to Contact points, located at the top of the Grafana alerting page.
Click on the blue + Add contact point button.
Now, you should be able to see setting page. Choose a name for your contact point.
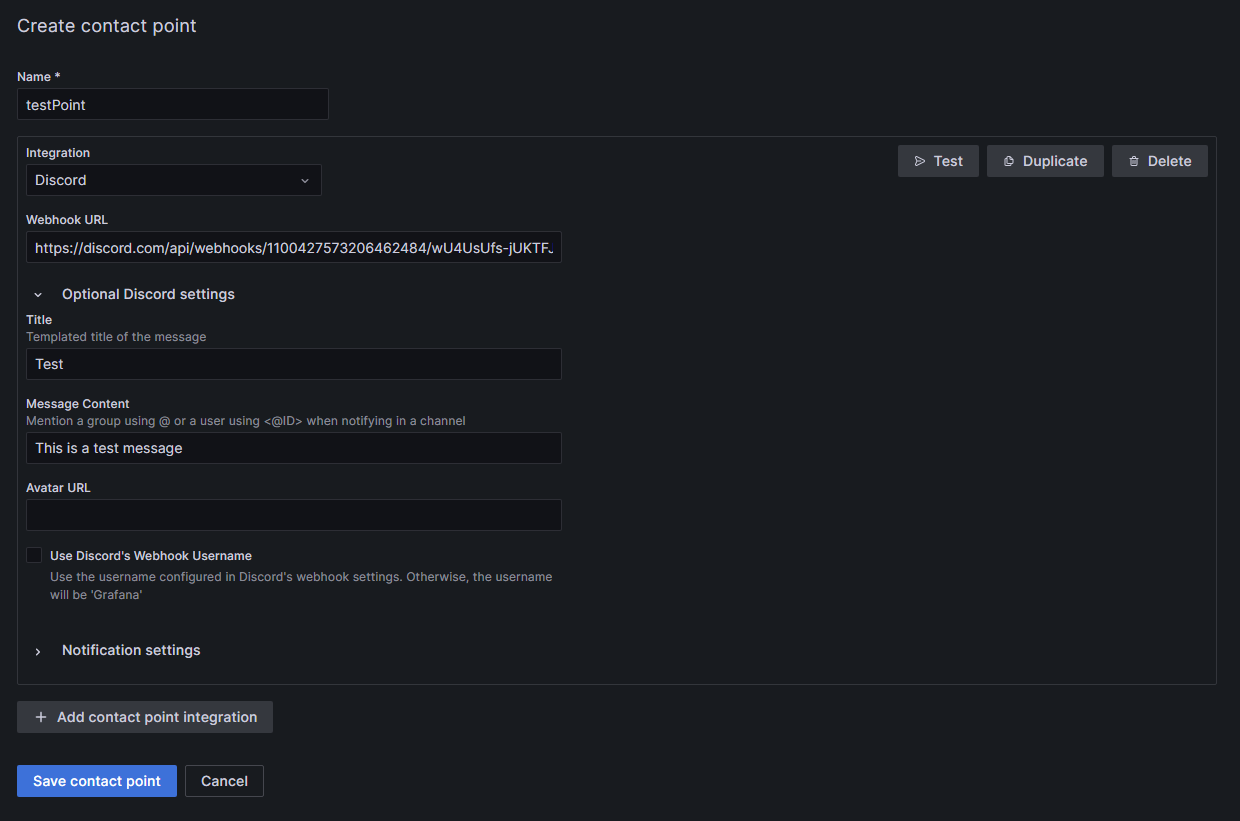
Pick the receiving service; in this example, Discord.
Generate a new Webhook in your Discord server (Server Settings ⇒ Integrations ⇒ View Webhooks ⇒ New Webhook or create Webhook). Assign a name to the Webhook and designate the messaging channel. Copy the Webhook URL from Discord and insert it into the corresponding field in Grafana. Customize the message to Discord under Optional Discord settings if desired.
If you need, add more services to the contact point, by clicking + Add contact point integration.
Save the contact point; you can see it in the Contact points list, below the grafana-default-email contact point.

Notification Policies
In a notification policy, you establish the connection of a contact point with the desired alerts. To add the notification policy, you need to do the following steps.
Go to the Notification policies section in the Grafana alerting page, next to the Contact points.
Select + New specific policy to create a new policy, followed by + Add matcher to choose the label and value from the alert (for example
team = operator). In this example, both alert1 and alert3 will be forwarded to the associated contact point. You can include multiple labels in a single notification policy.Choose the contact point designated to receive the alert notifications. Now, the inputs should be like in the picture.
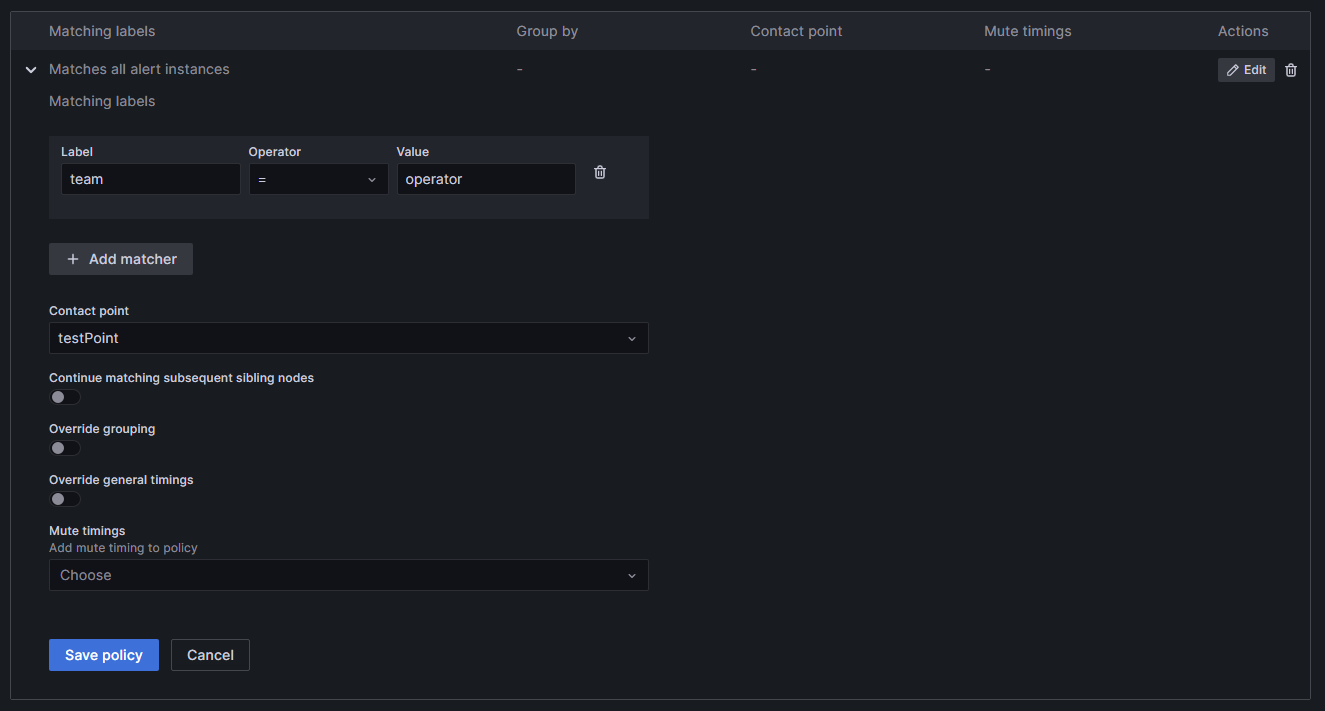
Press Save policy to finalize your settings. Your new policy will now be displayed in the list.

Mute Timing
In case you do not want to receive messages during a recurring time period, you can add a mute timing to Grafana. You can set up a mute timing in the Notification policies section.
Select + Add mute timing below the notification policies.
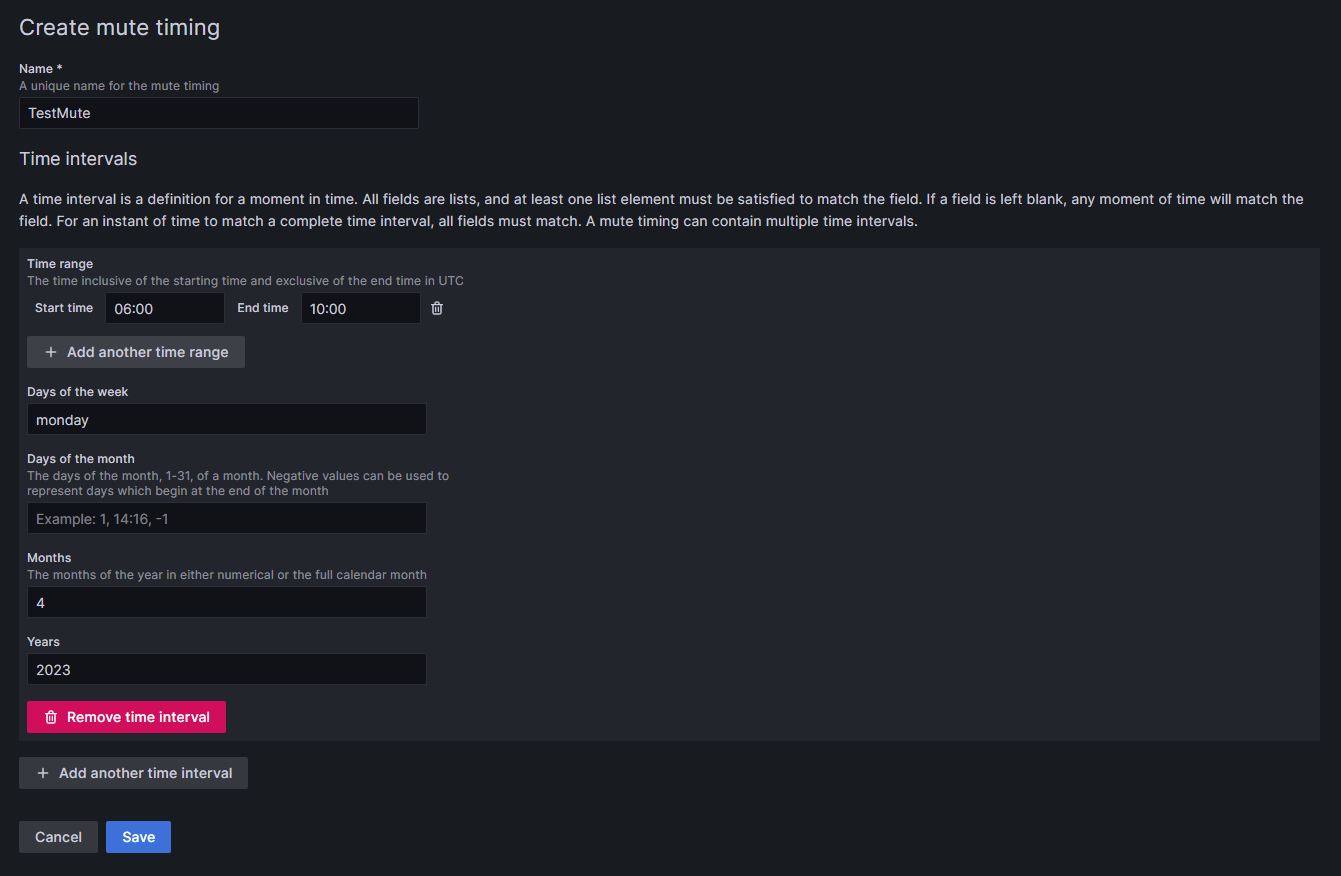
Choose a name for the mute timing.
Specify the time during which notifications should not be forwarded.
- Time has to be given in UTC time and formatted as HH:MM. Use 06:00 instead of 6:00 to avoid an error in Grafana.
You can combine several time intervals into one mute timing by clicking on the + Add another time interval button at the end of the page.
Click Submit to save your settings.
To apply the mute timing to a notification policy, click Edit on the right side of the notification policy, and then select the desired mute timing from the drop-down menu at the bottom of the policy. Click on Save Policy to apply the change.

Silence
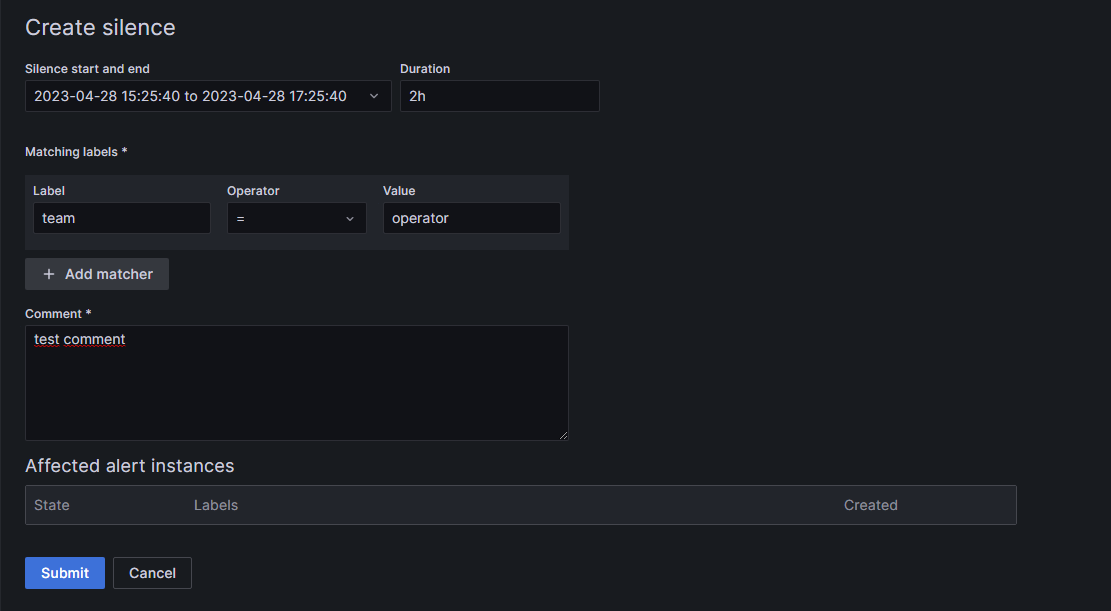
You can also add silences for a specific time frame and labels, in case you only want to mute alerts once. To add a silence, switch to the Silences section, next to Notification policies.
Click on + Add Silence.
Specify the beginning for the silence and its duration.
Select the labels and their values you want silenced.
If you need, you can add a comment to the silence.
Click the Submit button at the bottom of the page.

What are the limitations?
It can be complicated to select and manipulate the desired values to create the correct function for your application. Grafana cannot differentiate between data points of the same source. For example, you want to make a temperature threshold based on a single sensor. If your query selects the last three values and two of them are above the threshold, Grafana will fire two alerts which it cannot tell apart. This results in errors. You have to configure the rule to reduce the selected values to only one per source to avoid this. It can be complicated to create such a specific rule with this limitation, and it requires some testing.
Another thing to keep in mind is that the alerts can only work with data from the database. It also does not work with the machine status; these values only exist in a raw, unprocessed form in TimescaleDB and are not processed through an API like process values.