Monitoring & Management
3 minute read
The Management Console supports you to monitor and manage the Data Infrastructure and the Device & Container Infrastructure.
When should I use it?
Once initial deployment of the United Manufacturing Hub is completed, you can monitor and manage it using the Management Console. If you have not deployed yet, navigate to the Get Started! guide.
What can I do with it?
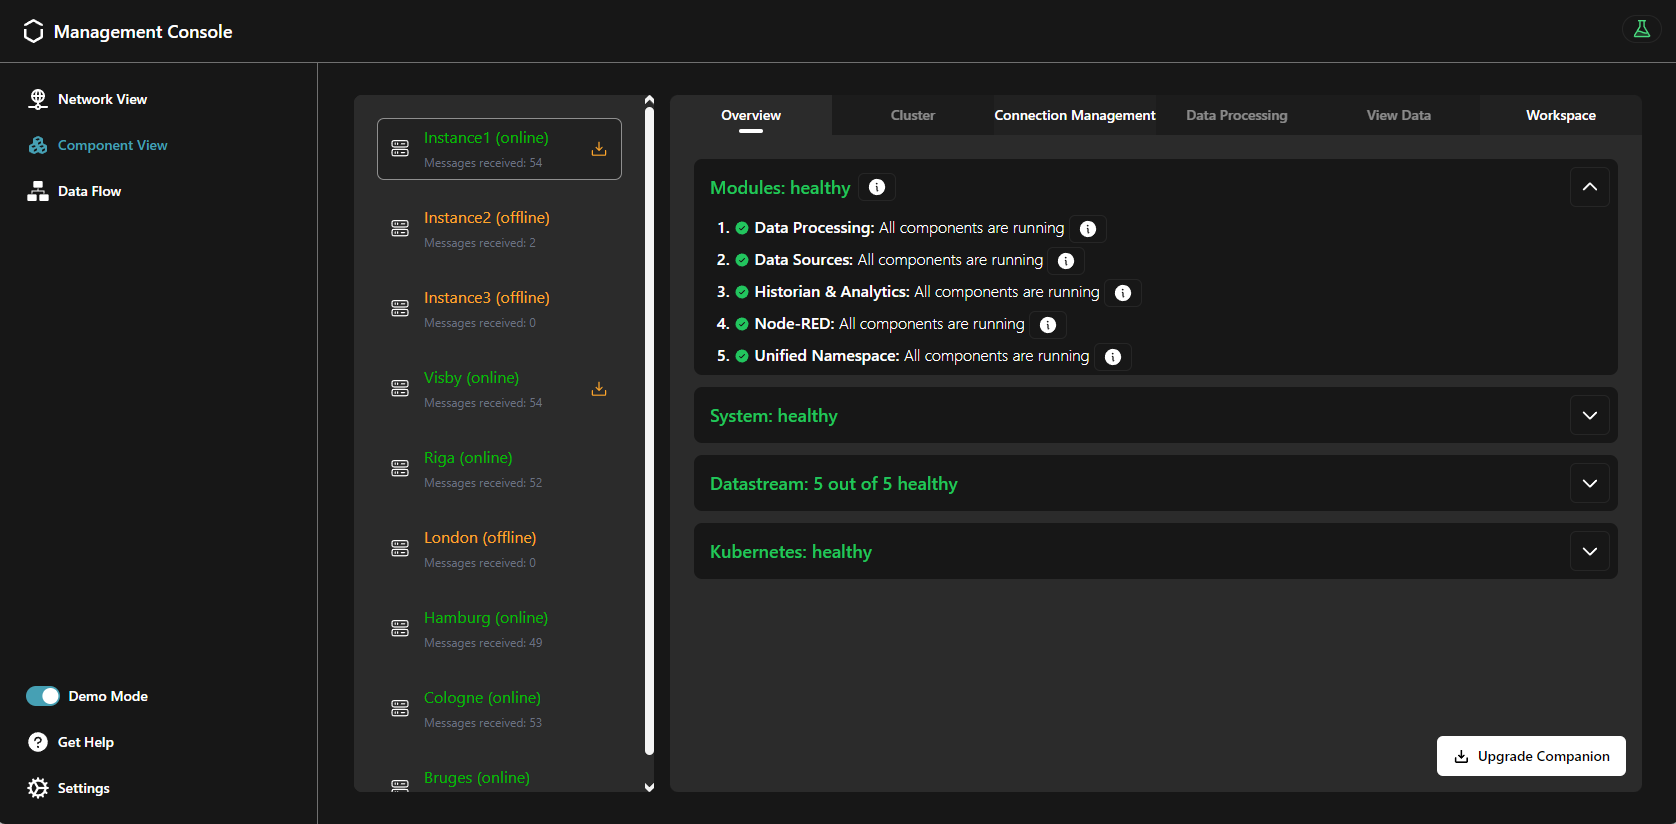
You can monitor the statuses of the following items using the Management Console:
- Modules: A Module refers to a grouped set of related Kubernetes components like Pods, StatefulSets, and Services. It provides a way to monitor and manage these components as a single unit.
- System:
- Resource Utilization: CPU, RAM, and DISK usages.
- OS information: the used operating system, kernel version, and instruction set architecture.
- Datastream: the rate of Kafka/TimescaleDB messages per second, the health of both connections and data sources.
- Kubernetes: the number of error events and the deployed management companion’s and UMH’s versions.
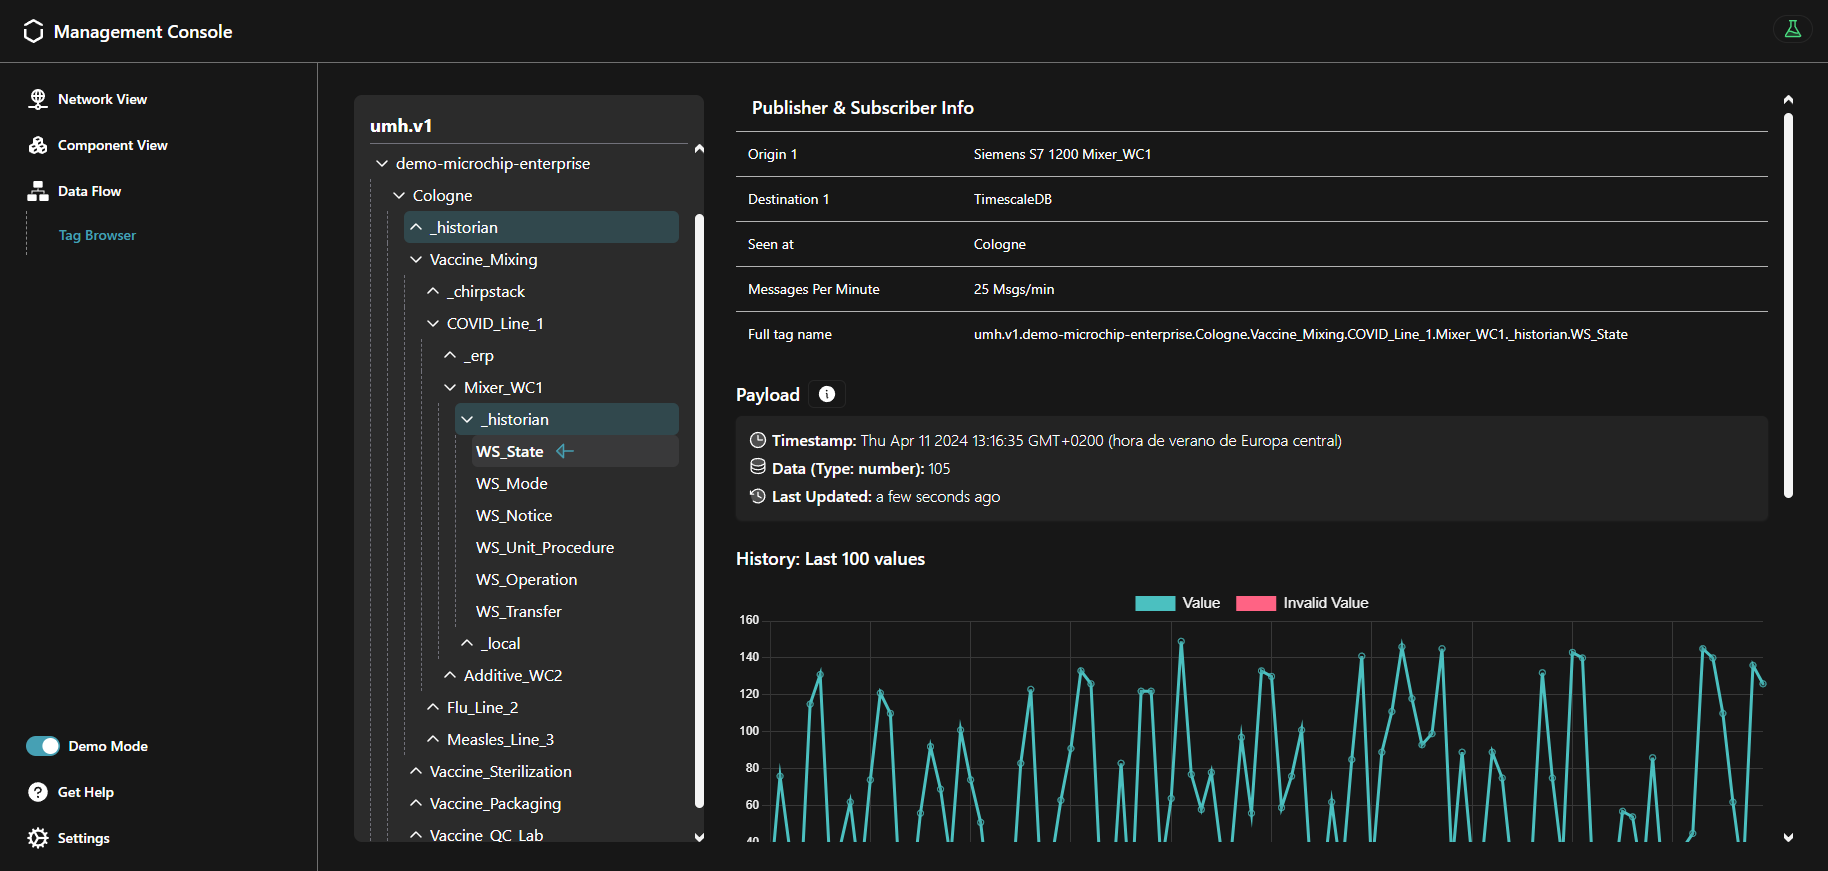
In addition, you can check the topic structure used by data sources and the corresponding payloads.
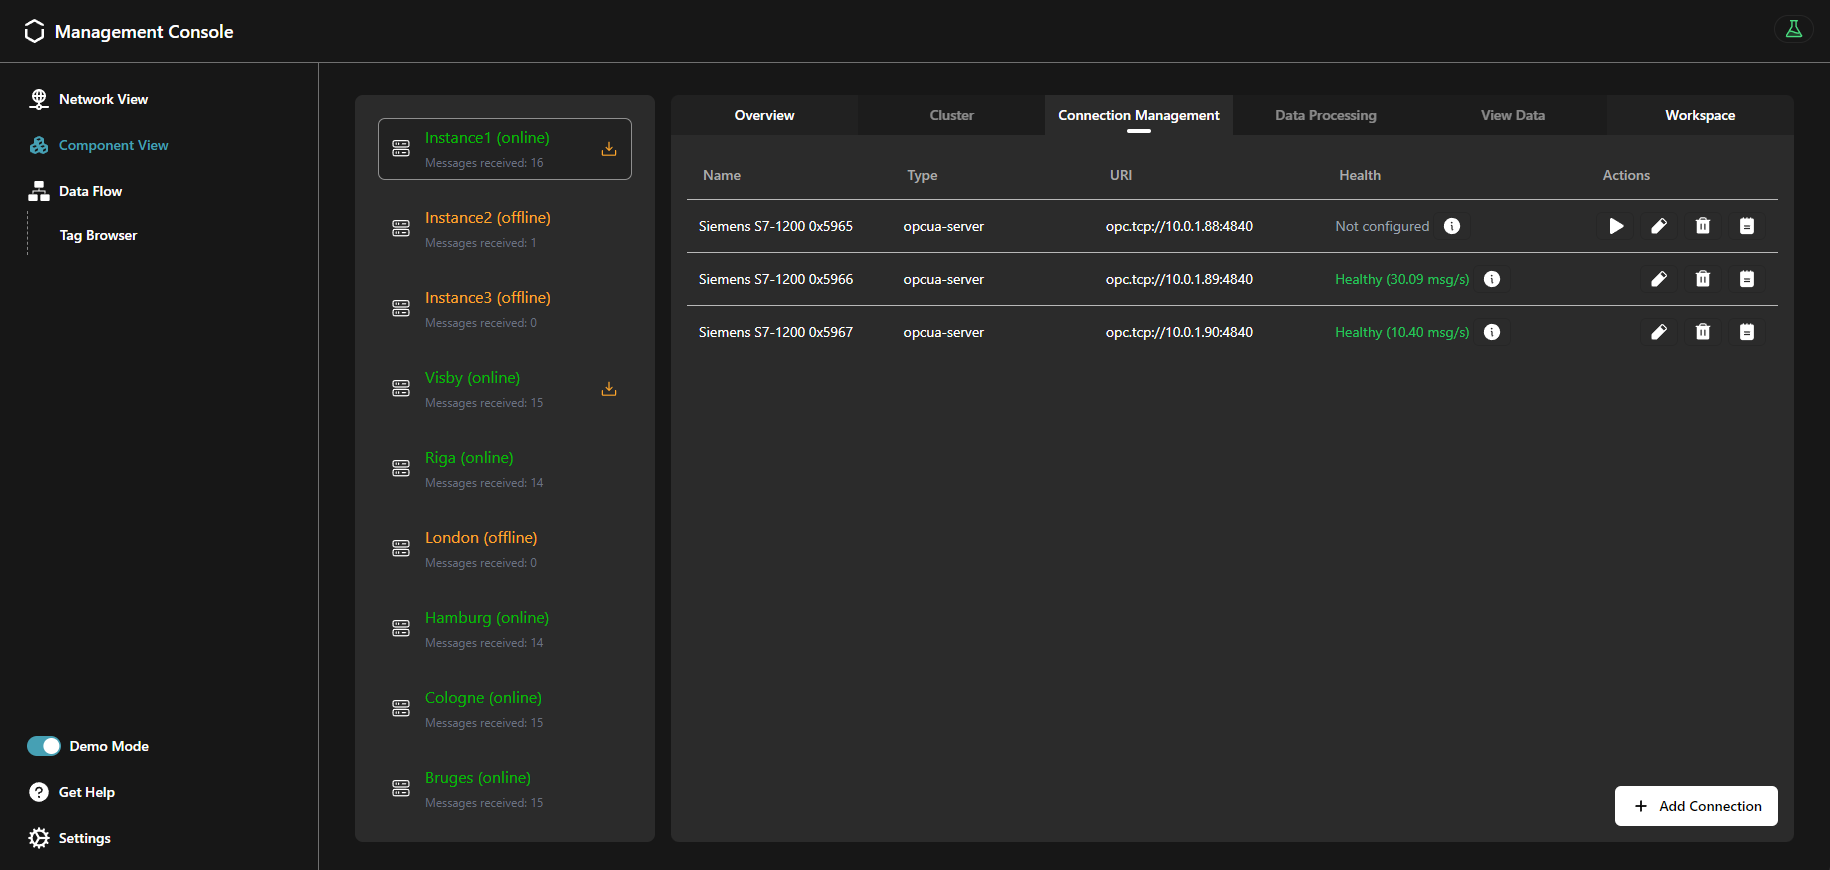
Moreover, you can create a new connection and initialize the created connection to deploy a data source.
How can I use it?
From the Component View, in the overview tab, you can click and open each status on this tab.
The Connection Management tab shows the status of all the instance’s connections and their associated data sources. Moreover, you can create a new connection, as well as initialize them. Read more about the Connection Management in the Connectivity section.
The Tag Browser provides a comprehensive view of the tag structure, allowing automation engineers to manage and navigate through all their tags without concerning themselves with underlying technical complexities, such as topics, keys or payload structures.
Tags typically represent variables associated with devices in an ISA-95 model. For instance, it could represent a temperature reading from a specific sensor or a status indication from a machine component. These tags are transported through various technical methods across the Unified Namespace (UNS) into the database. This includes organizing them within a folder structure or embedding them as JSON objects within the message payload. Tags can be sent into the same topic or utilizing various sub-topics. Due to the nature of MQTT and Kafka, the topics may differ, but the following formula applies:
MQTT Topic = Kafka topic + Kafka Key
The Kafka topic and key depend on the configured merge point, read more about it here.
Read more about the Tag Browser in the Unified Namespace section.
What are the limitations?
Presently, removing a UMH instance from the Management Console is not supported. After overwriting an instance, the old one will display an offline status.
Where to get more information?
- The Get Started! guide assists you to set up the United Manufacturing Hub.
- Learn more about the Data Infrastructure.
- Take a look at the Device & Container Infrastructure.


